Content from RとRStudio入門
最終更新日:2025-11-11 | ページの編集
概要
質問
- RStudio はどのように操作したらよいですか?
- R とはどのようにやりとりしたらよいですか?
- 環境の管理はどうしたらよいですか?
- パッケージのインストールはどうしたらよいですか?
目的
- RStudio IDE の各ウィンドウの使用目的と使い方が説明出来るようになりましょう。
- RStudio IDE のボタンやオプションの位置を理解しましょう。
- 変数が定義出来るようになりましょう。
- 変数に値の設定が出来るようになりましょう。
- R セッションのワークスペース管理が出来るようになりましょう。
- 算術演算子や比較演算子が使えるようになりましょう。
- 関数が呼び出せるようになりましょう。
- パーッケージをロードしましょう。
ワークショップを始める前に
RとRStudioの最新バージョンが、自分のコンピューターにインストールされているか確認してください。 最新バージョンであることが重要である理由は、ワークショップで使うパッケージには、Rが最新でないと、正常に(または全く)インストールされないものがあるからです。
R とRStudio を使う理由
Software CarpentryのR部分のワークショップへようこそ。
科学は複数の段階からなる作業です:実験を計画し、データを収集したら、 そこから本当の楽しみが始まります! このレッスンでは、R言語の基礎と、知っていると後々かなり楽になる科学的プロジェクトのためにコードを整える最適な方法をお教えます。
Microsoft Excel やGoogle スプレッドシートを使用してデータを分析することも可能ですが、これらのツールは柔軟性とアクセス性に限界があります。 特に、生データの探索や変更を行うステップを共有するのが難しいため、「再現可能」な研究には不向きです。
そのため、このレッスンではR とRStudio を使用してデータの探索を始める方法を学びます。 R プログラムはWindows、Mac、Linux のオペレーティングシステムで利用でき、無料で上記からダウンロード可能です。 R を実行するにはR プログラムだけで十分です。
ただし、R の使用をより簡単にするために、上記でダウンロードしたRStudio を使用します。 RStudioは、無料であり、Rを組み込んだオープンソースの 総合開発環境(IDE: Integrated Development Environment)です。 RStudioは、全てのプラットフォーム(サーバーも含む)で起動できること、 エディタが組み込まれていることや、プロジェクト管理やバージョン管理にも対応しているなど、 良いところがいっぱいがあります。
概要
生のデータから、予備解析をし、結果をどう グラフ上にプロットするかを学びます。 ここでの例は gapminder.org のデータセットを使います。このデータセットには、多くの国の人口の時系列データが入っています。 データをRに読み込むことができますか? セネガルの人口をプロットできますか? アジア大陸にある国の平均所得を計算できますか? これらのレッスンの終わるまでに、これらの全ての国の人口をプロットしたりするようなことが 一分足らずでできるようになるでしょう!
基本的なレイアウト
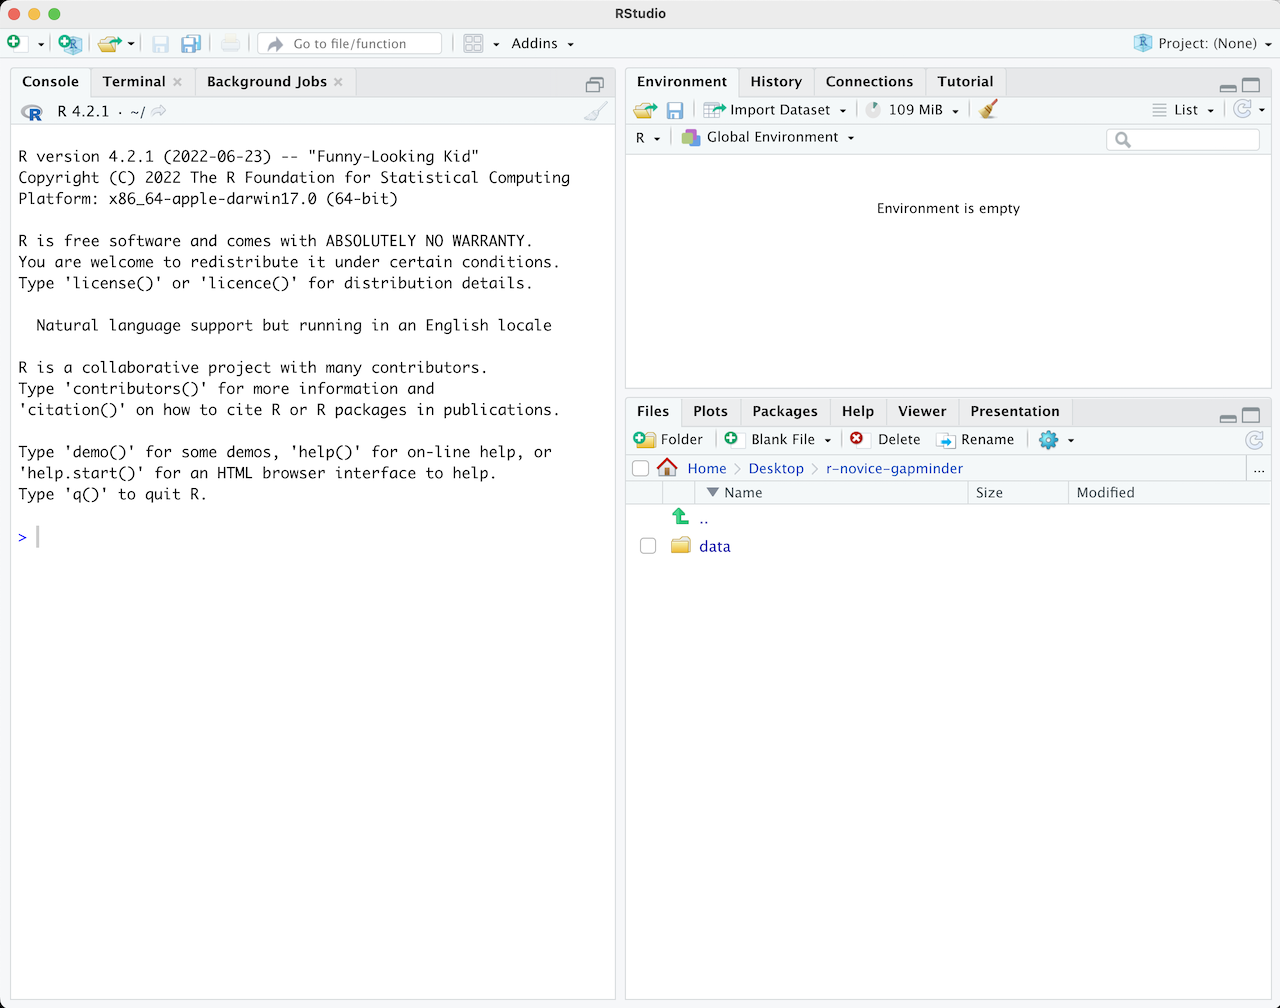
最初にRStudioを開くと、3つのパネルが現れます:
- インタラクティブなRコンソール(左側全部)
- 環境/履歴(右上のタブ形式)
- Files/Plots/Packages/Help/Viewer(右下のタブ形式)
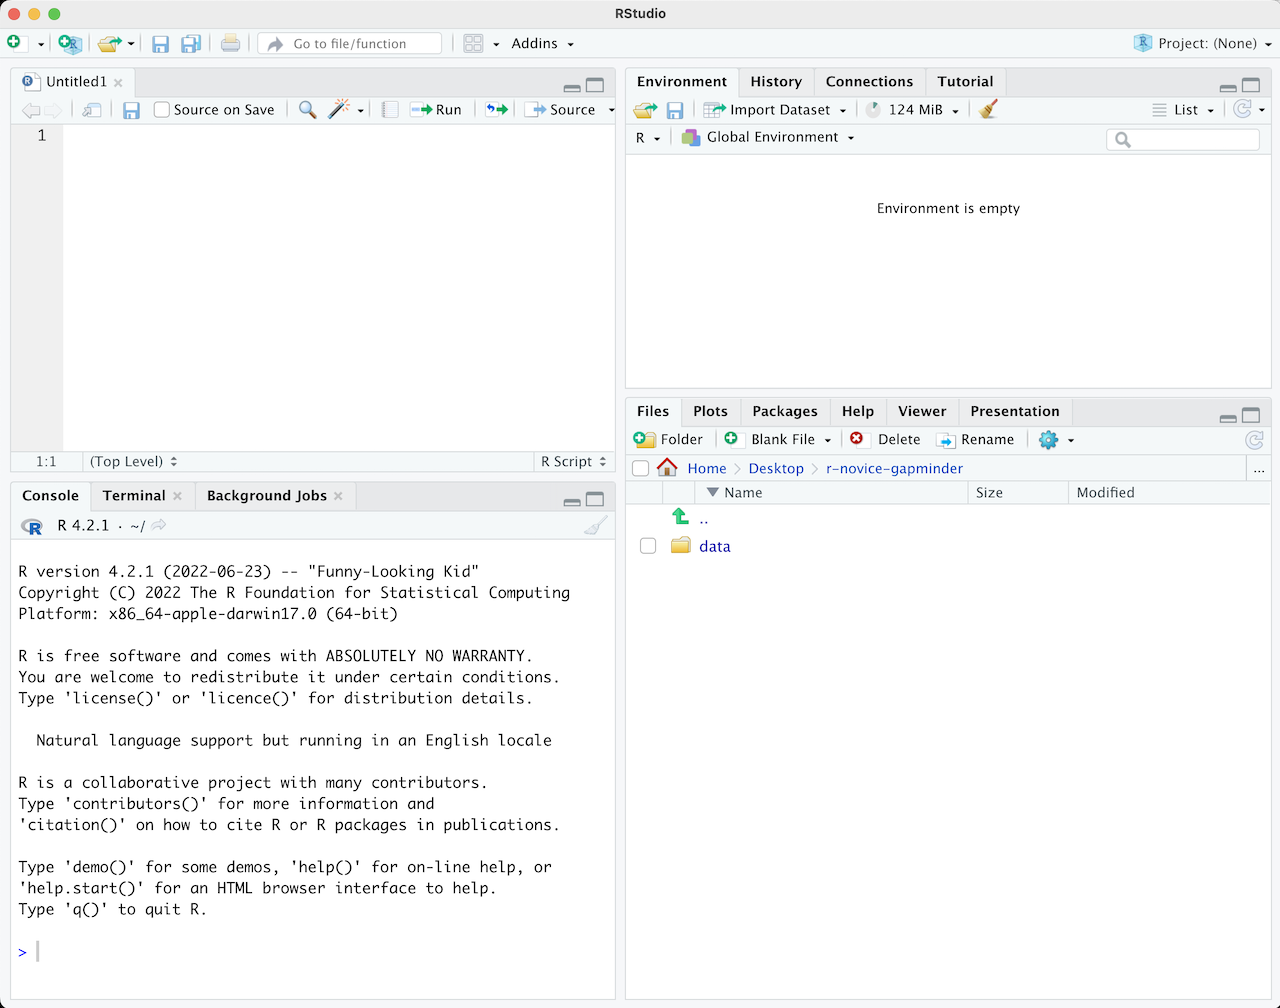
Rスクリプトなどのファイルを開くと、左上にエディタパネルも開きます。
R スクリプト
R コンソールに書き込んだコマンドは、再度実行するために
ファイルに保存することができます。 このように実行される R
コードを含むファイルは R スクリプトと呼ばれます。 R スクリプトには
.R が名前の末尾にが付けられています。
RStudioでの作業の流れ
RStudioで作業する2つの主な方法:
- インタラクティブなRコンソールで試したり、確認したりした後、コードを.
- まず始めてみるときや、小規模なテストをするのに適している。
- すぐ面倒になる。
- まず .R ファイルに書き、インタラクティブな R コンソールへ、現在の行、選択した行、 修正した行など送るコマンドを走らせるために、RStudio のショートカットキーを使う。
- 始めるのによい方法。全てのコードが後々のために保存される。
- 作ったファイルを、RStudioから又は
source()関数を使って走らせることができる。
ヒント:ひとかたまりのコードを走らせる
RStudio には、エディタからコードを走らせる色々な方法があります。 ボタン、メニュー選択、そしてキーボードのショートカットがあります。 現在の行を走らせるには、
- エディタパネルの
Runのボタンをクリックする - 「Code」メニューから「Run Lines」を選択する
- WindowsかLinuxなら、Ctrl+Return 、またはOS
Xなら、⌘+Return
を押す(このショートカットはボタンの上にマウスを合わせると表示される)。
ードのかたまりを走らせるには、まずその部分を選択してから
Runを押します。 もし、コードのかたまりを走らせた後で、その一部を修正した場合、 その部分を選択してRunする必要はありません。その場合は次のRe-run the previous regionボタンが使えます。これは、前のコードのかたまりを 修正を行った部分を含めて走らせます。 これは、前のコードのかたまりを 修正を行った部分を含めて走らせます。
R入門
Rを使う時間のほとんどは、Rのインタラクティブコンソールでの作業となるでしょう。
ここが、全てのコードを走らせる、また、.Rファイルにコードを加える前にアイディアを
試してみるのに使える環境となります。
このRStudioのコンソールが、コマンドライン環境にR
と入力するのと同じ環境になります。
Rインタラクティブセッションでまず目に入ってくるのは、ひとかたまりの情報と その後に続く、「 」と点滅するカーソルです。これは多くの観点で、 シェルのレッスンで学んだシェル環境と似ています。 つまり、「読み、実行し、出力するループ」の考えと同じように動くので、 コマンドを入力すれば、Rは、それを実行しようとし、そして結果を返すのです。
Rを計算機としての使用
一番単純なRの使い方は、演算です:
R
1 + 100
出力
[1] 101And R will print out the answer, with a preceding “[1]”. [1] is the index of the first element of the line being printed in the console. For more information on indexing vectors, see Episode 6: Subsetting Data.
バッシュのように、Rは、不完全なコマンドが入力されると、それが完成されるまで待ちます: If you are familiar with Unix Shell’s bash, you may recognize this behavior from bash.
出力
+Any time you hit return and the R session shows a “+” instead of a “>”, it means it’s waiting for you to complete the command. If you want to cancel a command you can hit Esc and RStudio will give you back the “>” prompt.
ヒント:コマンドの取り消し
RStudioではなく、コマンドラインからRを使う場合、 コマンドを取り消す場合、Escの代わりにCtrl+Cを使う必要があります。これは、Macユーザーも同じです! コマンドの取り消しは、不完全なコマンドを消す他にも使えます。
走っているコードを止めてとRに伝えるにも使え(例えば、予想よりも かなり長くかかっている場合)、その他にも、今書いているコードを 消去するにも使えます。
Rを計算機として使う場合、演算の順番は、学校で学んだだろうものと 同じです。
一番先に行われる処理から一番後に行われる処理:
- 括弧:
( ) - 累乗:
^か** - 掛ける:
* - 割る:
/ - 加える:
+ - 引く:
-
R
3 + 5 * 2
出力
[1] 13デフォルトと違う順番で計算させたい場合や、意図を明確にしたい場合は、 演算をまとめるために、括弧を使いましょう。
R
(3 + 5) * 2
出力
[1] 16括弧をつける必要ではないときは、面倒かもしれませんが、そうすることで自分の意図 するところがはっきり伝わります。 自分が書いたコードを、後々他の人が読むことになるかもしれないことを忘れないように。
R
(3 + (5 (2 ^ 2))) # 読みづらい 3 + 5 2 ^ 2 # ルールを覚えている人には明確 3 + 5 (2 ^ 2) # ルールを忘れている人にも伝わるはず
コードの後の文は、「コメント」と呼ばれます。
シャープ(ナンバー)記号#
の後に来るものは、Rがコードを実行する際は無視されます。
とても大きい、又は小さい数には、指数表記が使われます:
R
2/10000
出力
[1] 2e-04Which is shorthand for “multiplied by 10^XX”. So
2e-4 is shorthand for 2 * 10^(-4).
数を指数記号で書くこともできます:
R
5e3 # マイナスがないことに注意
出力
[1] 5000数学関数
R has many built in mathematical functions. To call a function, we can type its name, followed by open and closing parentheses. Functions take arguments as inputs, anything we type inside the parentheses of a function is considered an argument. Depending on the function, the number of arguments can vary from none to multiple. 例えば:
R
getwd() #returns an absolute filepath
doesn’t require an argument, whereas for the next set of mathematical functions we will need to supply the function a value in order to compute the result.
R
sin(1) # 三角関数
出力
[1] 0.841471R
log(1) # 自然対数
出力
[1] 0R
log10(10) # 10を底とする対数
出力
[1] 1R
exp(0.5) # e^(1/2)
出力
[1] 1.648721Googleで検索すればいいですし、関数の始まりさえ覚えていれば RStudioのタブ入力補完機能が使えます。
これがRStudioが、Rそのものを使うよりもいい理由のひとつです。 RStudioには、自動補完機能があり、関数、その引数、その取りうる値を より簡単に見つけることができます。
コマンド名の前に、?
を付けることで、そのコマンドのヘルプのページを開くことができます。 When
using RStudio, this will open the ‘Help’ pane; if using R in the
terminal, the help page will open in your browser. The help page will
include a detailed description of the command and how it works.
Scrolling to the bottom of the help page will usually show a collection
of code examples which illustrate command usage.
これについては、後ほど、例で見てみることにしましょう。
何かを比較する
Rを使って比較をすることもできます:
R
~~~ 1 == 1 # 等価(イコールが2つあることに注意。「は、~と等しい」と読む) ~~~
出力
~~~1 == 1R
~~~ 1 != 2 # 不等価(「は、~と等しくない」と読む) ~~~
出力
~~~1 != 2R
1 < 2 # より少ない
出力
[1] TRUER
1 <= 1 # より少ない、又は等しい
出力
[1] TRUEエラー
Error in parse(text = input): <text>:1:3: unexpected numeric constant
1: 1 0
      ^
R
1 = -9 # より大きい、又は等しい
エラー
Error in 1 = -9: invalid (do_set) left-hand side to assignment##ヒント: 数の比較
A word of warning about comparing numbers: you should never use
== to compare two numbers unless they are integers (a data
type which can specifically represent only whole numbers).
Computers may only represent decimal numbers with a certain degree of precision, so two numbers which look the same when printed out by R, may actually have different underlying representations and therefore be different by a small margin of error (called Machine numeric tolerance).
Instead you should use the all.equal function.
Further reading: http://floating-point-gui.de/
変数及び代入
代入演算子<-を用いて、次のように値を変数に入れることができます:
R
x <- 1/40
Notice that assignment does not print a value. Instead, we stored it
for later in something called a variable.
x now contains the value
0.025:
R
x
出力
[1] 0.025より正確には、記録された値は、浮動小数点数 と呼ばれる 小数近似 (decimal approximation) です。
Look for the Environment tab in the top right panel of
RStudio, and you will see that x and its value have
appeared. Our variable x can be used in place of a number
in any calculation that expects a number:
R
log(x)
出力
[1] -3.688879変数は、再度、代入することもできます:
R
x <- 100
xは、0.025という値でしたが、今は、100になりました。
代入する値は、既に代入されている変数でもいいです:
R
x <- x + 1 #RStudioが、右上のタブにあるxの詳細をどう更新したかにも御留意下さい y <- x 2
代入の右側については、Rで使える表現であれば何でも大丈夫です。 右側については、代入される前に、 計算が完全に実施 されます。
変数名には、文字、数字、下線、ピリオドを含むことができます。 They must start with a letter or a period followed by a letter (they cannot start with a number nor an underscore). Variables beginning with a period are hidden variables. 長い変数名のつけ方は様々です。例えば、
- ピリオドを.単語の.間に入れる
- 下線を\_単語の_間に入れる
- 単語の始まりを大文字にする(camelCaseToSeparateWords)
何を使うかは書き手次第ですが、 一貫性を持たせる ようにしましょう。
代入の演算子として、=を使うこともできます:
R
x = 1/40
But this is much less common among R users. The most important thing
is to be consistent with the operator you use. There
are occasionally places where it is less confusing to use
<- than =, and it is the most common symbol
used in the community. So the recommendation is to use
<-.
ベクトル化
One final thing to be aware of is that R is vectorized, meaning that variables and functions can have vectors as values. In contrast to physics and mathematics, a vector in R describes a set of values in a certain order of the same data type. 例えば:
R
1:5
出力
[1] 1 2 3 4 5R
2^(1:5)
出力
[1] 2 4 8 16 32R
x <- 1:5
2^x
出力
[1] 2 4 8 16 32これは、とても使えるのですが、詳しくは後続のレッスンで述べることにします。
環境を管理する
Rセッションで使えるコマンドがいくつかあります。
lsは、グローバル環境(作業中のRセッション)にある全ての変数と関数をリスト化します:
R
ls()
エラー
Error: object 'y' not found出力
[1] "x"ヒント:隠れたオブジェクト
シェルのように、lsはデフォルトでは、“.”で始まる変数と関数を表示しません。
全てのオブジェクトをリスト化するには、代わりにls(all.names=TRUE)と書きます
ここでは、lsに特に引数を与えませんでしたが、それでもRに関数を
呼び出していることを伝えるために括弧は必要です。
If we type ls by itself, R prints a bunch of code
instead of a listing of objects.
R
ls
出力
function (name, pos = -1L, envir = as.environment(pos), all.names = FALSE,
    pattern, sorted = TRUE)
{
    if (!missing(name)) {
        pos <- tryCatch(name, error = function(e) e)
        if (inherits(pos, "error")) {
            name <- substitute(name)
            if (!is.character(name))
                name <- deparse(name)
            warning(gettextf("%s converted to character string",
                sQuote(name)), domain = NA)
            pos <- name
        }
    }
    all.names <- .Internal(ls(envir, all.names, sorted))
    if (!missing(pattern)) {
        if ((ll <- length(grep("[", pattern, fixed = TRUE))) &&
            ll != length(grep("]", pattern, fixed = TRUE))) {
            if (pattern == "[") {
                pattern <- "\\["
                warning("replaced regular expression pattern '[' by  '\\\\['")
            }
            else if (length(grep("[^\\\\]\\[<-", pattern))) {
                pattern <- sub("\\[<-", "\\\\\\[<-", pattern)
                warning("replaced '[<-' by '\\\\[<-' in regular expression pattern")
            }
        }
        grep(pattern, all.names, value = TRUE)
    }
    else all.names
}
<bytecode: 0x55c00f645fd0>
<environment: namespace:base>
What’s going on here?
Like everything in R, ls is the name of an object, and
entering the name of an object by itself prints the contents of the
object. The object x that we created earlier contains 1, 2,
3, 4, 5:
R
x
出力
[1] 1 2 3 4 5The object ls contains the R code that makes the
ls function work! We’ll talk more about how functions work
and start writing our own later.
もう必要ないオブジェクトを消去するには、rmが使えます:
R
rm(x)
もし、環境に、色々なものがいっぱいあって、それらを全て消去したい場合、
lsの結果をrm関数に渡すことで対応できます。:
R
rm(list = ls())
In this case we’ve combined the two. ここでは、二つを組み合わせました。演算の順番のように、一番内側の括弧の中のものが、 まず最初に実行され、実行が続きます。
ここでは、lsの結果をrmの引数のリストとして用いるべしと設定しました。
名前で引数の値を定めるときは、演算子=を 必ず
使わなければなりません!
もし代わりに<-を使うと、意図しない副作用が現れるか、エラーメッセージが現れます:
R
rm(list <- ls())
エラー
Error in rm(list <- ls()): ... must contain names or character stringsヒント:警告かエラーか
Pay attention when R does something unexpected! Errors, like above, are thrown when R cannot proceed with a calculation. Warnings on the other hand usually mean that the function has run, but it probably hasn’t worked as expected.
In both cases, the message that R prints out usually give you clues how to fix a problem.
Rパッケージ
It is possible to add functions to R by writing a package, or by obtaining a package written by someone else. As of this writing, there are over 10,000 packages available on CRAN (the comprehensive R archive network). R and RStudio have functionality for managing packages:
- インストールされているパッケージを以下を入力することで見ることができます。
- You can install packages by typing
install.packages("packagename"), wherepackagenameis the package name, in quotes. - You can update installed packages by typing
update.packages() - You can remove a package with
remove.packages("packagename") - You can make a package available for use with
library(packagename)
Packages can also be viewed, loaded, and detached in the Packages tab of the lower right panel in RStudio. Clicking on this tab will display all of the installed packages with a checkbox next to them. If the box next to a package name is checked, the package is loaded and if it is empty, the package is not loaded. Click an empty box to load that package and click a checked box to detach that package.
Packages can be installed and updated from the Package tab with the Install and Update buttons at the top of the tab.
チャレンジ2
次のプログラムのそれぞれの宣言の後、それぞれの変数の値は 何になるでしょうか?
R
mass <- 47.5
age <- 122
mass <- mass * 2.3
age <- age - 20
R
mass <- 47.5
This will give a value of 47.5 for the variable mass
R
age <- 122
This will give a value of 122 for the variable age
R
mass <- mass * 2.3
This will multiply the existing value of 47.5 by 2.3 to give a new value of 109.25 to the variable mass.
R
age <- age - 20
This will subtract 20 from the existing value of 122 to give a new value of 102 to the variable age.
チャレンジ3
チャレンジ2のコードを走らせ、massとageを比較するコマンドを書いて下さい。 massはageよりも大きいでしょうか?
One way of answering this question in R is to use the
> to set up the following:
R
mass > age
出力
[1] TRUEThis should yield a boolean value of TRUE since 109.25 is greater than 102.
チャレンジ4
Clean up your working environment by deleting the mass and age variables.
We can use the rm command to accomplish this task
R
rm(age, mass)
チャレンジ5
Install the following packages: ggplot2,
plyr, gapminder
We can use the install.packages() command to install the
required packages.
R
install.packages("ggplot2")
install.packages("plyr")
install.packages("gapminder")
An alternate solution, to install multiple packages with a single
install.packages() command is:
R
install.packages(c("ggplot2", "plyr", "gapminder"))
- Use RStudio to write and run R programs.
- R has the usual arithmetic operators and mathematical functions.
- Use
<-to assign values to variables. - Use
ls()to list the variables in a program. - Use
rm()to delete objects in a program. - Use
install.packages()to install packages (libraries).
Content from Project Management With RStudio
最終更新日:2025-11-11 | ページの編集
概要
質問
- How can I manage my projects in R?
目的
- Create self-contained projects in RStudio
はじめに
科学的なプロセスは、徐々に進んでいくものです。プロジェクトの多くは、 計画性のないメモやいくつかのコードから始まります。そして、原案ができ、 最終的に、全てが少しづつ混ざり合ってまとまっていくのです。
Managing your projects in a reproducible fashion doesn’t just make your science reproducible, it makes your life easier.
— Vince Buffalo (@vsbuffalo) April 15, 2013
大抵の人達は、次のようにプロジェクトを整理する傾向にあります:
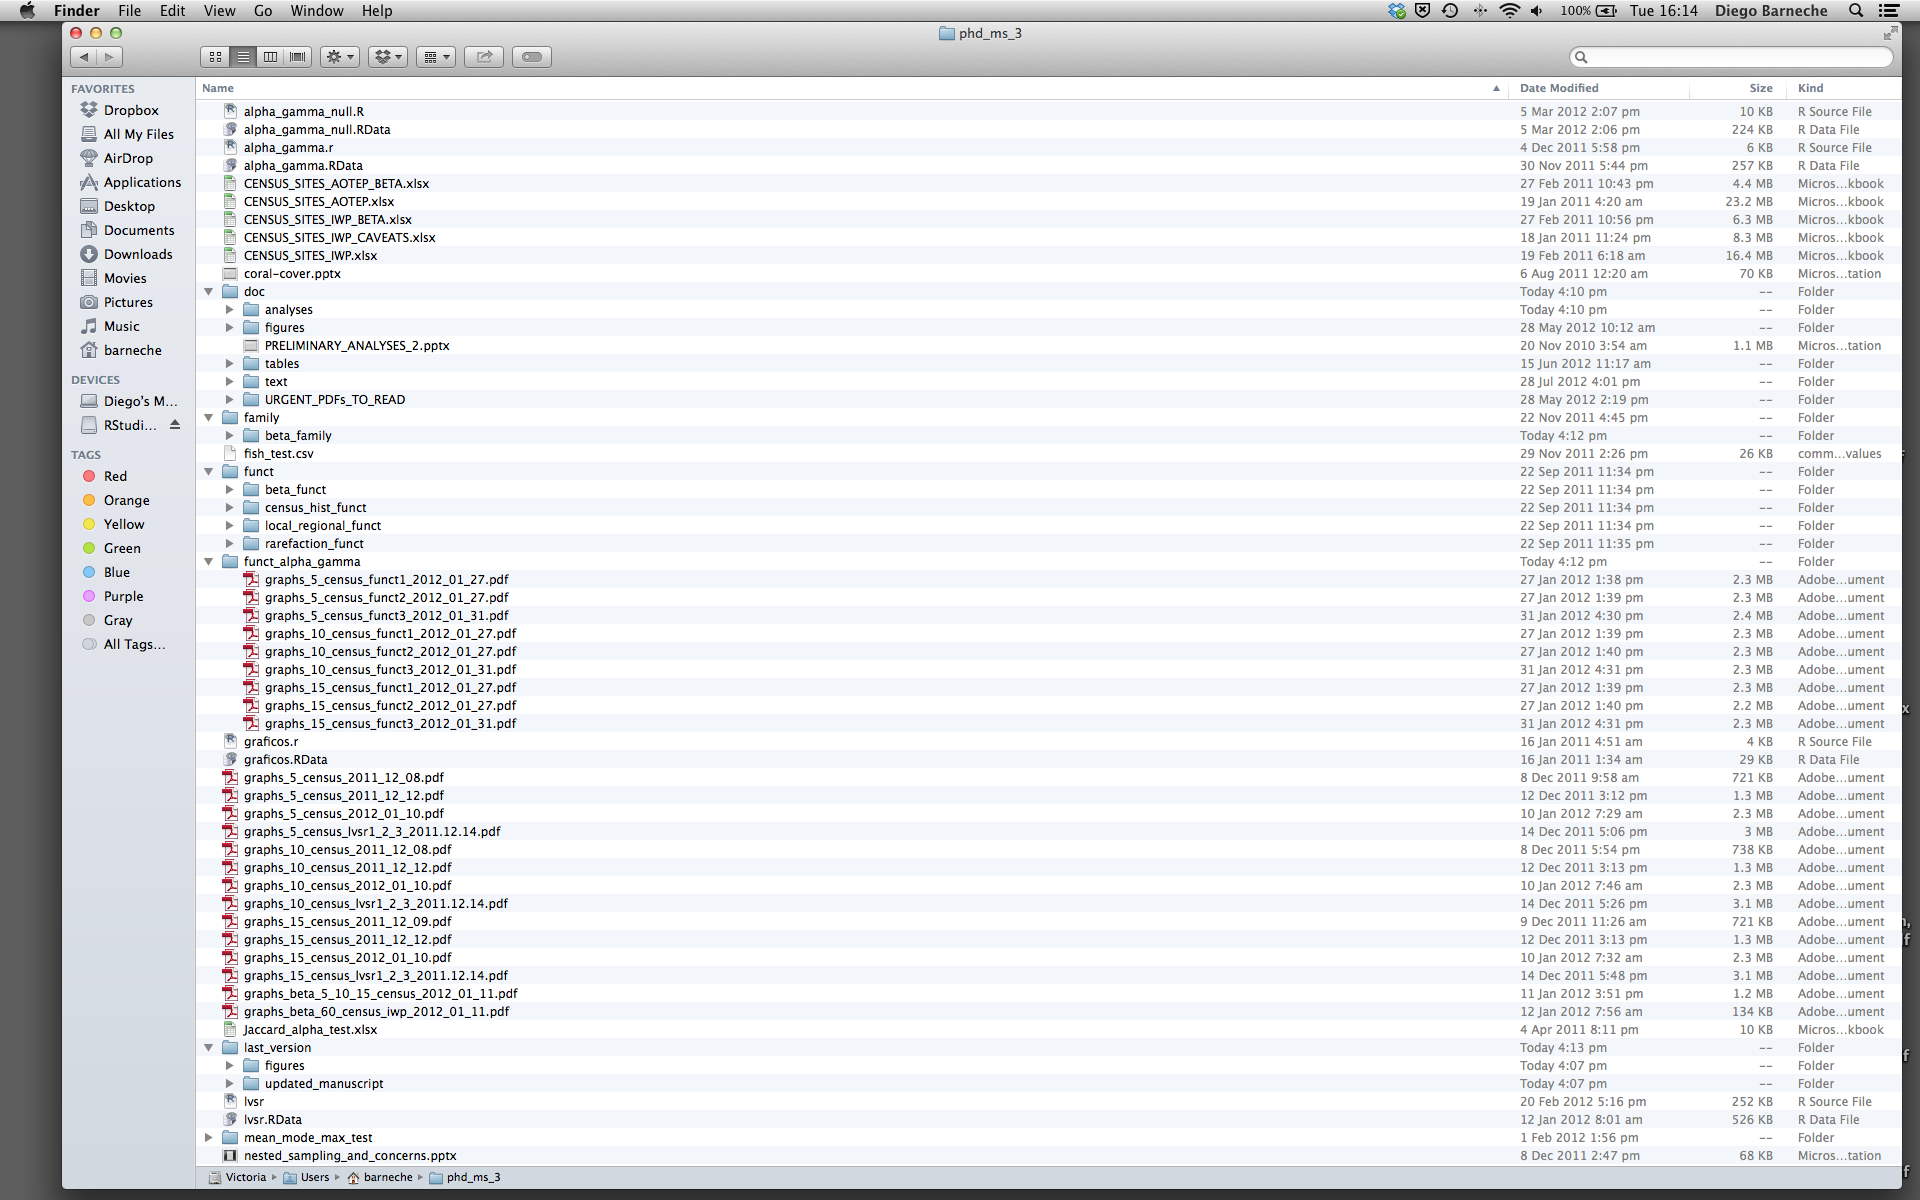
このようなことを 絶対 避けるべき理由はいくつもあります:
- It is really hard to tell which version of your data is the original and which is the modified;
- It gets really messy because it mixes files with various extensions together;
- It probably takes you a lot of time to actually find things, and relate the correct figures to the exact code that has been used to generate it;
プロジェクトのレイアウトが良ければ、最終的に自分が楽になる
- 自分のデータの整合性を保つ助けになる
- It makes it simpler to share your code with someone else (a lab-mate, collaborator, or supervisor);
- It allows you to easily upload your code with your manuscript submission;
- It makes it easier to pick the project back up after a break.
考えられる解決策
幸いなことに、効果的な作業管理を助けるツールやパッケージがあります
RStudioの最も有能て使えるもののひとつとして、プロジェクト管理機能が挙げられます。 今日では、必要なものが揃い、再現可能なプロジェクトを作成するために、これが使われているのでしょう。
チャレンジ:必要なものが揃ったプロジェクトを作成する
We’re going to create a new project in RStudio:
- Click the “File” menu button, then “New Project”.
- Click “New Directory”.
- Click “New Project”.
- Type in the name of the directory to store your project, e.g. “my_project”.
- If available, select the checkbox for “Create a git repository.”
- Click the “Create Project” button.
The simplest way to open an RStudio project once it has been created
is to click through your file system to get to the directory where it
was saved and double click on the .Rproj file. This will
open RStudio and start your R session in the same directory as the
.Rproj file. All your data, plots and scripts will now be
relative to the project directory. RStudio projects have the added
benefit of allowing you to open multiple projects at the same time each
open to its own project directory. This allows you to keep multiple
projects open without them interfering with each other.
Challenge 2: Opening an RStudio project through the file system
- Exit RStudio.
- Navigate to the directory where you created a project in Challenge 1.
- Double click on the
.Rprojfile in that directory.
プロジェクト管理の最適なやり方
プロジェクトのレイアウトに「最適」な方法はありませんが、これを守れば、 プロジェクト管理が簡単になるだろうという一般的な原則がいくつかあります:
データは読み込み専用にしましょう
プロジェクトを始めるにあたって、これが多分一番重要なゴールかもしれません。 データ収集には、多くの時間と費用のいずれか、または両方が掛かることが多いものです。 データの修正も行える形で読込みも書込みもできる作業(例えば、エクセル)をすると、 データがどこからきたか、または収集されてからどう修正されてきたかが分からなくなります。 ですから、データは「読み込むだけ」のものと扱うのがよいというわけです。
データクリーニング
多くの場合、データは「汚れて」います: R(または、他のプログラミング言語)が使える形にするためには、かなりの前処理が必要となるでしょう。 この作業は、「データ・マンジング」と呼ばれることもあります。 Storing these scripts in a separate folder, and creating a second “read-only” data folder to hold the “cleaned” data sets can prevent confusion between the two sets.
生成されたアウトプットを捨てても良いようにしましょう
書いたものから生成されたものは、全て捨てても良いものにしましょう。 つまり、書いたものから生成できるようにしましょう。
There are lots of different ways to manage this output. Having an output folder with different sub-directories for each separate analysis makes it easier later. Since many analyses are exploratory and don’t end up being used in the final project, and some of the analyses get shared between projects.
ヒント:科学的演算の良いと言えるやり方
Good Enough Practices for Scientific Computing gives the following recommendations for project organization:
- Put each project in its own directory, which is named after the project.
- Put text documents associated with the project in the
docdirectory. - Put raw data and metadata in the
datadirectory, and files generated during cleanup and analysis in aresultsdirectory. - Put source for the project’s scripts and programs in the
srcdirectory, and programs brought in from elsewhere or compiled locally in thebindirectory. - Name all files to reflect their content or function.
関数定義と適用は別々にしましょう
Rで作業するより効果的な方法のひとつは、まず走らせたいコードを直接.Rスクリプトに書き、それから選択した行をインタラクティブなRコンソールで(RStudioのショートカットキーを使うか、「Run」ボタンをクリックして)走らせることです。
プロジェクトの初期段階では、最初の.Rスクリプトファイルには直接実行されるコードの行が多数あるものです。 プロジェクトが進むにつれて、何度も使える部分は、独自の関数としてまとめられます。 これらの関数を、色々なプロジェクトや分析で使える関数を保存するフォルダと、この分析のスクリプトを保存するフォルダの2つの異なるフォルダに分けるとよいでしょう。
データディレクトリにデータを保存しましょう
よいディレクトリ構造ができた後は、データファイルを data/
ディレクトリに置く、または保管しましょう。
チャレンジ3
Download the gapminder data from this link to a csv file.
- Download the file (right mouse click on the link above -> “Save link as” / “Save file as”, or click on the link and after the page loads, press Ctrl+S or choose File -> “Save page as”)
- Make sure it’s saved under the name
gapminder_data.csv - Save the file in the
data/folder within your project.
We will load and inspect these data later.
チャレンジ4
It is useful to get some general idea about the dataset, directly from the command line, before loading it into R. Understanding the dataset better will come in handy when making decisions on how to load it in R. Use the command-line shell to answer the following questions:
- ファイルのサイズは何ですか?
- データは何列入っていますか?
- ファイルには、どのような値が保存されていますか?
By running these commands in the shell:
出力
-rw-r--r-- 1 runner runner 80K Nov 11 02:14 data/gapminder_data.csvThe file size is 80K.
出力
1705 data/gapminder_data.csvThere are 1705 lines. The data looks like:
出力
country,year,pop,continent,lifeExp,gdpPercap
Afghanistan,1952,8425333,Asia,28.801,779.4453145
Afghanistan,1957,9240934,Asia,30.332,820.8530296
Afghanistan,1962,10267083,Asia,31.997,853.10071
Afghanistan,1967,11537966,Asia,34.02,836.1971382
Afghanistan,1972,13079460,Asia,36.088,739.9811058
Afghanistan,1977,14880372,Asia,38.438,786.11336
Afghanistan,1982,12881816,Asia,39.854,978.0114388
Afghanistan,1987,13867957,Asia,40.822,852.3959448
Afghanistan,1992,16317921,Asia,41.674,649.3413952ヒント:R Studioのコマンドライン
The Terminal tab in the console pane provides a convenient place directly within RStudio to interact directly with the command line.
Working directory
Knowing R’s current working directory is important because when you need to access other files (for example, to import a data file), R will look for them relative to the current working directory.
Each time you create a new RStudio Project, it will create a new
directory for that project. When you open an existing
.Rproj file, it will open that project and set R’s working
directory to the folder that file is in.
チャレンジ5
You can check the current working directory with the
getwd() command, or by using the menus in RStudio.
- In the console, type
getwd()(“wd” is short for “working directory”) and hit Enter. - In the Files pane, double click on the
datafolder to open it (or navigate to any other folder you wish). To get the Files pane back to the current working directory, click “More” and then select “Go To Working Directory”.
You can change the working directory with setwd(), or by
using RStudio menus.
- In the console, type
setwd("data")and hit Enter. Typegetwd()and hit Enter to see the new working directory. - In the menus at the top of the RStudio window, click the “Session”
menu button, and then select “Set Working Directory” and then “Choose
Directory”. Next, in the windows navigator that opens, navigate back to
the project directory, and click “Open”. Note that a
setwdcommand will automatically appear in the console.
Tip: File does not exist errors
When you’re attempting to reference a file in your R code and you’re getting errors saying the file doesn’t exist, it’s a good idea to check your working directory. You need to either provide an absolute path to the file, or you need to make sure the file is saved in the working directory (or a subfolder of the working directory) and provide a relative path.
バージョン・コントロール
プロジェクトでは、バージョン・コントロールを使うことが重要です。 RStudioでGitを使う良いレッスンを参照して下さい。
- Use RStudio to create and manage projects with consistent layout.
- データは読み込み専用にしましょう.
- 生成されたアウトプットを捨てても良いようにしましょう.
- 関数定義と適用は別々にしましょう.
Content from Seeking Help
最終更新日:2025-11-11 | ページの編集
概要
質問
- How can I get help in R?
目的
- To be able to read R help files for functions and special operators.
- To be able to use CRAN task views to identify packages to solve a problem.
- To be able to seek help from your peers.
ヘルプファイルを読む
R、そしてその他のパッケージには、関数のヘルプファイルが用意されています。 一般的な関数のヘルプを検索する構文は、(インタラクティブなRセッションで)自分の名前空間に読み込まれた パッケージに存在する特定の関数名、「function_name」を以下のように使って下さい:
R
?function_name
help(function_name)
For example take a look at the help file for
write.table(), we will be using a similar function in an
upcoming episode.
R
?write.table()
これで、RStudioにヘルプページ(Rの場合は、画面に簡素なテキスト)が表示されます
それぞれのヘルプページは、セクションに分けられます:
- Description(説明):関数がすることの詳しい説明
- Usage(使い方):関数の引数及びデフォルトの値
- Arguments(引数):それぞれの引数が取りうるデータの説明
- Details(詳細):気を付けるべき重要な詳細
- Value(値):関数が返すデータ
- See Also(ついでにこっちも):他に役立ちそうな関連する関数
- Examples(例):関数の使い方の例
関数によって、違うセクションがあるかもしれませんが、知っておくべき主要なものは以上でしょう。
Notice how related functions might call for the same help file:
R
?write.table()
?write.csv()
This is because these functions have very similar applicability and often share the same arguments as inputs to the function, so package authors often choose to document them together in a single help file.
Tip: Running Examples
From within the function help page, you can highlight code in the Examples and hit Ctrl+Return to run it in RStudio console. This gives you a quick way to get a feel for how a function works.
ヒント:ヘルプファイルを読む
Rの気が滅入る点は、多くの関数があるという点です。 自分が使う全ての関数の正しい使い方を覚えるのは不可能とまでは言いませんが、かなり大変でしょう。 Luckily, using the help files means you don’t have to remember that!
特別な演算子
特別な演算子を検索するためには、引用符を使いましょう:
R
?"<-"
?`<-`
パッケージについてのヘルプを入手する
Many packages come with “vignettes”: tutorials and extended example
documentation.
多くのパッケージには、「ビニエット(vignette)」があります。これは、使い方の説明や詳細な例を掲載する資料です。
引数なしに、vignette()
と入力すると、インストールされているパッケージの全てのビニエットの一覧が表示されます。
vignette(package="package-name")
と入力すると、package-nameについての全てのビニエットの一覧が表示され、
vignette("vignette-name")
と入力すると、指定されたビニエットが開きます。
もしパッケージにビニエットがひとつもない場合、通常
help("package-name") と入力するとヘルプが表示されます。
RStudio also has a set of excellent cheatsheets for many packages.
When You Remember Part of the Function Name
関数がどのパッケージに入っているか、またはスペルが定かではないとき、あいまい検索をすることもできます:
R
??function_name
A fuzzy search is when you search for an approximate string match. For example, you may remember that the function to set your working directory includes “set” in its name. You can do a fuzzy search to help you identify the function:
R
??set
どうしていいか分からない場合
関数やパッケージが分からない場合、CRAN Task Viewsという 分野ごとにまとめられたパッケージのリストがあります。 このページから探し始めるといいかもしれません。
コードがうまく動作しない:仲間の助けが必要な場合
関数がうまく動かない場合、十中八九、探している問の答えは、 Stack Overflowに掲載されいます。
[r] タグを使って検索ができます。 Please make sure to see
their page on how to
ask a good question.
もし答えが見つからない場合、仲間に質問をする際に 役に立つ関数がいくつかあります:
R
?dput
これで、あなたが使っているデータを誰にでもコピー・アンド・ペーストしてRセッションで使える 形式にすることができます。
R
sessionInfo()
出力
R version 4.5.2 (2025-10-31)
Platform: x86_64-pc-linux-gnu
Running under: Ubuntu 22.04.5 LTS

Matrix products: default
BLAS:   /usr/lib/x86_64-linux-gnu/blas/libblas.so.3.10.0
LAPACK: /usr/lib/x86_64-linux-gnu/lapack/liblapack.so.3.10.0  LAPACK version 3.10.0

locale:
 [1] LC_CTYPE=C.UTF-8       LC_NUMERIC=C           LC_TIME=C.UTF-8
 [4] LC_COLLATE=C.UTF-8     LC_MONETARY=C.UTF-8    LC_MESSAGES=C.UTF-8
 [7] LC_PAPER=C.UTF-8       LC_NAME=C              LC_ADDRESS=C
[10] LC_TELEPHONE=C         LC_MEASUREMENT=C.UTF-8 LC_IDENTIFICATION=C

time zone: UTC
tzcode source: system (glibc)

attached base packages:
[1] stats     graphics  grDevices utils     datasets  methods   base

loaded via a namespace (and not attached):
 [1] assertthat_0.2.1      R6_2.6.1              xfun_0.47
 [4] magrittr_2.0.4        glue_1.8.0            knitr_1.48
 [7] sandpaper_0.17.2.9000 lifecycle_1.0.4       xml2_1.4.1
[10] ps_1.9.1              cli_3.6.5             processx_3.8.6
[13] callr_3.7.6           vctrs_0.6.5           renv_1.1.5
[16] withr_3.0.2           compiler_4.5.2        purrr_1.2.0
[19] tools_4.5.2           tinkr_0.3.0           evaluate_1.0.0
[22] yaml_2.3.10           pegboard_0.7.9        rlang_1.1.6
これは、現在使っている R のバージョン、そして読み込まれている全てのパッケージを表示させる関数です。 他の人が問題点を再現し、バグを見つける際にこの情報が役立つこともあります。
チャレンジ1
Look at the help page for the c function. What kind of
vector do you expect will be created if you evaluate the following:
R
c(1, 2, 3)
c('d', 'e', 'f')
c(1, 2, 'f')
The c() function creates a vector, in which all elements
are of the same type. In the first case, the elements are numeric, in
the second, they are characters, and in the third they are also
characters: the numeric values are “coerced” to be characters.
チャレンジ2
Look at the help for the paste function. You will need
to use it later. What’s the difference between the sep and
collapse arguments?
To look at the help for the paste() function, use:
R
help("paste")
?paste
The difference between sep and collapse is
a little tricky. The paste function accepts any number of
arguments, each of which can be a vector of any length. The
sep argument specifies the string used between concatenated
terms — by default, a space. The result is a vector as long as the
longest argument supplied to paste. In contrast,
collapse specifies that after concatenation the elements
are collapsed together using the given separator, the result
being a single string.
It is important to call the arguments explicitly by typing out the
argument name e.g sep = "," so the function understands to
use the “,” as a separator and not a term to concatenate. e.g.
R
paste(c("a","b"), "c")
出力
[1] "a c" "b c"R
paste(c("a","b"), "c", ",")
出力
[1] "a c ," "b c ,"R
paste(c("a","b"), "c", sep = ",")
出力
[1] "a,c" "b,c"R
paste(c("a","b"), "c", collapse = "|")
出力
[1] "a c|b c"R
paste(c("a","b"), "c", sep = ",", collapse = "|")
出力
[1] "a,c|b,c"(For more information, scroll to the bottom of the
?paste help page and look at the examples, or try
example('paste').)
チャレンジ3
Use help to find a function (and its associated parameters) that you
could use to load data from a tabular file in which columns are
delimited with “\t” (tab) and the decimal point is a “.” (period). This
check for decimal separator is important, especially if you are working
with international colleagues, because different countries have
different conventions for the decimal point (i.e. comma vs period).
Hint: use ??"read table" to look up functions related to
reading in tabular data.
The standard R function for reading tab-delimited files with a period
decimal separator is read.delim(). You can also do this with
read.table(file, sep="\t") (the period is the
default decimal separator for read.table()),
although you may have to change the comment.char argument
as well if your data file contains hash (#) characters.
その他の資料
- Use
help()to get online help in R.
Content from Data Structures
最終更新日:2025-11-11 | ページの編集
概要
質問
- How can I read data in R?
- What are the basic data types in R?
- How do I represent categorical information in R?
目的
- To be able to identify the 5 main data types.
- To begin exploring data frames, and understand how they are related to vectors and lists.
- To be able to ask questions from R about the type, class, and structure of an object.
- To understand the information of the attributes “names”, “class”, and “dim”.
Rのすごい特徴のひとつは、表形式のデータ(既に手元にあるようなスプレッドシートやCSVファイル)が扱えることです。
まず、 data/ ディレクトリに feline-data.csv
というお試しのデータセットを作ってみましょう。
R
cats <- data.frame(coat = c("calico", "black", "tabby"),
                    weight = c(2.1, 5.0, 3.2),
                    likes_string = c(1, 0, 1))
We can now save cats as a CSV file. It is good practice
to call the argument names explicitly so the function knows what default
values you are changing. Here we are setting
row.names = FALSE. Recall you can use
?write.csv to pull up the help file to check out the
argument names and their default values.
R
write.csv(x = cats, file = "data/feline-data.csv", row.names = FALSE)
新しいファイル feline-data.csv の内容:
ヒント:Rを使ったテキスト形式のファイルの編集
あるいは、テキストエディタ(Nano)またはをRStudioのメニューから File
- New File - Text File を使って data/feline-data.csv
を作成することができます。
以下を使って作ったデータをRへ読み込ませることができます:
R
cats <- read.csv(file = "data/feline-data.csv")
cats
出力
coat weight likes_string
1 calico 2.1 1
2 black 5.0 0
3 tabby 3.2 1このread.table関数は、CSVファイル(csv = comma-separated
values)のように、
データの列が区読文字で分けられたテキストファイルに収められた表形式データを
読み込むために使われます。
タブとコンマは、csvファイルでデータ点を区切る、又は分けるために使われる
最も一般的な句読文字です。
便宜上、Rでは、他に2つのread.tableのバージョンが提供されています。
ひとつは、データがコンマで分けられているファイルのための
read.csv 、 データがタブで分けられているファイルのための
read.delim です。
これら3つの関数のうち、read.csv が最も広く使われています。
必要であれば、 read.csv と read.delim、両方の
デフォルトの句読記号を置き換えることができます。
Check your data for factors
In recent times, the default way how R handles textual data has changed. Text data was interpreted by R automatically into a format called “factors”. But there is an easier format that is called “character”. We will hear about factors later, and what to use them for. For now, remember that in most cases, they are not needed and only complicate your life, which is why newer R versions read in text as “character”. Check now if your version of R has automatically created factors and convert them to “character” format:
- Check the data types of your input by typing
str(cats) - In the output, look at the three-letter codes after the colons: If you see only “num” and “chr”, you can continue with the lesson and skip this box. If you find “fct”, continue to step 3.
- Prevent R from automatically creating “factor” data. That can be
done by the following code:
options(stringsAsFactors = FALSE). Then, re-read the cats table for the change to take effect. - You must set this option every time you restart R. To not forget this, include it in your analysis script before you read in any data, for example in one of the first lines.
- For R versions greater than 4.0.0, text data is no longer converted to factors anymore. So you can install this or a newer version to avoid this problem. If you are working on an institute or company computer, ask your administrator to do it.
演算子 $
を使って列を指定し、列を抜き出すことで、すぐにデータセットの探索を始めることができます:
R
cats$weight
出力
[1] 2.1 5.0 3.2R
cats$coat
出力
[1] "calico" "black" "tabby" 列に他の操作をすることもできます:
R
## Say we discovered that the scale weighs two Kg light:
cats$weight + 2
出力
[1] 4.1 7.0 5.2R
paste("My cat is", cats$coat)
出力
[1] "My cat is calico" "My cat is black" "My cat is tabby" でも、こうしたらどうだろう
R
cats$weight + cats$coat
エラー
Error in cats$weight + cats$coat: non-numeric argument to binary operatorここで何が起こったかを理解することが、データをRでうまく分析する鍵となります。
データ型
最後のコマンドがエラーを返すのは 2.1 足す
"black" はナンセンスだからだろうと思ったとしたら、
それは正解で、既にプログラミングにおける データ型
という重要な概念をある程度分かっていると言えます。
データ型が何かを知るには、以下を使います:
R
typeof(cats$weight)
出力
[1] "double"主な型は5つあります:double(浮動小数点型)、integer(整数型)、complex(複素数型)、logical(論理型)、そしてcharacter(文字型)。
For historic reasons, double is also called
numeric.
R
typeof(3.14)
出力
[1] "double"R
typeof(1L) # The L suffix forces the number to be an integer, since by default R uses float numbers
出力
[1] "integer"R
typeof(1+1i)
出力
[1] "complex"R
typeof(TRUE)
出力
[1] "logical"R
typeof('banana')
出力
[1] "character"どんなに分析が複雑になっても、 Rにある全てのデータは、この基本データ型のいずれかとして解釈されます。 この厳格性によって、とても重要なことが後々起こることもあります。
あるユーザーが他の猫の詳細を加えたとします。 情報は
data/feline-data_v2.csv ファイルにあるものです。
R
file.show("data/feline-data_v2.csv")
先ほどのように、この新しい猫の情報を読み込み、 weight
の列が、 どんなデータ型が確認してみましょう。
R
cats <- read.csv(file="data/feline-data_v2.csv")
typeof(cats$weight)
出力
[1] "character"なんと、この weight はdouble型ではないじゃありませんか! 前と同じように計算をしようとすると、 やっかいなことになります:
R
cats$weight + 2
エラー
Error in cats$weight + 2: non-numeric argument to binary operator何が起こったのでしょう?Rは、csvファイルを読み込む際、
列にある全てのものが同じ基本の型であるべきだと主張します。もし、列の
全て が、 double型であることが確認できない場合、その列の だれも
double型にならないのです。 The cats data we are working
with is something called a data frame. Data frames are one of
the most common and versatile types of data structures we will
work with in R. A given column in a data frame cannot be composed of
different data types. In this case, R does not read everything in the
data frame column weight as a double, therefore
the entire column data type changes to something that is suitable for
everything in the column.
When R reads a csv file, it reads it in as a data frame.
Thus, when we loaded the cats csv file, it is stored as a
data frame. We can recognize data frames by the first row that is
written by the str() function:
R
str(cats)
出力
'data.frame': 4 obs. of 3 variables:
$ coat : chr "calico" "black" "tabby" "tabby"
$ weight : chr "2.1" "5" "3.2" "2.3 or 2.4"
$ likes_string: int 1 0 1 1Data frames are composed of rows and columns, where each column has the same number of rows. Different columns in a data frame can be made up of different data types (this is what makes them so versatile), but everything in a given column needs to be the same type (e.g., vector, factor, or list).
Let’s explore more about different data structures and how they behave. For now, let’s remove that extra line from our cats data and reload it, while we investigate this behavior further:
feline-data.csv:
coat,weight,likes_string
calico,2.1,1
black,5.0,0
tabby,3.2,1RStudioに戻ります:
R
cats <- read.csv(file="data/feline-data.csv")
ベクトル及び型強制
この動作をより理解するために、もう一つのデータ構造 ベクトル を紹介します。
R
my_vector <- vector(length = 3)
my_vector
出力
[1] FALSE FALSE FALSERのベクトルは、本来、
ベクトルの中の全てのものは同じ基本データ型でなければいけない
という特別な条件のある、 順番を付けられたもののリストです。
もし、データ型を選ばなければ、デフォルトでlogicalになりますが、好きなデータ型を持つ空のベクトルを
宣言することもできます。
R
another_vector <- vector(mode='character', length=3)
another_vector
出力
[1] "" "" ""以下を使えばベクトルかどうかを確かめられます:
R
str(another_vector)
出力
chr [1:3] "" "" ""このコマンドから出てきた暗号みたいなアウトプットによると、このベクトルの基本データ型(ここでは
chr (文字型))、 数(実際には、ベクトルの添字、この場合
[1:3] )、
そして中身のいくつかの例示(この場合、空の文字列)が示されています。
cats$weightに同じようなことをすると:
R
str(cats$weight)
出力
num [1:3] 2.1 5 3.2ここでcats$weight もまたベクトルであることが分かります。
Rのデータフレームに読み込まれたデータの列は全てベクトル で、
Rが全ての列を同じ基本データ型にする理由です。
議論1
Why is R so opinionated about what we put in our columns of data? How does this help us?
By keeping everything in a column the same, we allow ourselves to make simple assumptions about our data; if you can interpret one entry in the column as a number, then you can interpret all of them as numbers, so we don’t have to check every time. This consistency is what people mean when they talk about clean data; in the long run, strict consistency goes a long way to making our lives easier in R.
Coercion by combining vectors
合成関数で明確な内容を持つベクトルを作ることもできます:
R
combine_vector <- c(2,6,3)
combine_vector
出力
[1] 2 6 3これまで学んだことを踏まえて、以下は何を生み出すでしょうか。
R
quiz_vector <- c(2,6,'3')
This is something called type coercion, and it is the source of many surprises and the reason why we need to be aware of the basic data types and how R will interpret them. When R encounters a mix of types (here double and character) to be combined into a single vector, it will force them all to be the same type. Consider:
R
coercion_vector <- c('a', TRUE)
coercion_vector
出力
[1] "a" "TRUE"R
another_coercion_vector <- c(0, TRUE)
another_coercion_vector
出力
[1] 0 1The type hierarchy
強制化のルールは、logical - integer -
numeric - complex - character
です。ここで、 - は、 ~が変換されるのは~ という意味です。 For example,
combining logical and character transforms the
result to character:
R
c('a', TRUE)
出力
[1] "a" "TRUE"A quick way to recognize character vectors is by the
quotes that enclose them when they are printed.
この流れに逆らう強制化も、as. 関数を使ってできます:
R
character_vector_example <- c('0','2','4')
character_vector_example
出力
[1] "0" "2" "4"R
character_coerced_to_double <- as.double(character_vector_example)
character_coerced_to_double
出力
[1] 0 2 4R
double_coerced_to_logical <- as.logical(character_coerced_to_double)
double_coerced_to_logical
出力
[1] FALSE TRUE TRUEご覧のとおり、Rがある基本のデータ型を他へ変換すると、驚くことが起こります。 型強制の核心はさておき、ポイントは:もし、データが思っていたものと違っている場合、 型強制が原因かもしれないという事です。ベクトルの中、データフレームの列を全て同じ型にすること、 さもなくば、いやなサプライズに会う羽目になるかもしれません。
But coercion can also be very useful! For example, in our
cats data likes_string is numeric, but we know
that the 1s and 0s actually represent TRUE and
FALSE (a common way of representing them). We should use
the logical datatype here, which has two states:
TRUE or FALSE, which is exactly what our data
represents. We can ‘coerce’ this column to be logical by
using the as.logical function:
R
cats$likes_string
出力
[1] 1 0 1R
cats$likes_string <- as.logical(cats$likes_string)
cats$likes_string
出力
[1] TRUE FALSE TRUEチャレンジ1
An important part of every data analysis is cleaning the input data. If you know that the input data is all of the same format, (e.g. numbers), your analysis is much easier! Clean the cat data set from the chapter about type coercion.
Copy the code template
Create a new script in RStudio and copy and paste the following code. Then move on to the tasks below, which help you to fill in the gaps (______).
# Read data
cats <- read.csv("data/feline-data_v2.csv")
# 1. Print the data
_____
# 2. Show an overview of the table with all data types
_____(cats)
# 3. The "weight" column has the incorrect data type __________.
# The correct data type is: ____________.
# 4. Correct the 4th weight data point with the mean of the two given values
cats$weight[4] <- 2.35
# print the data again to see the effect
cats
# 5. Convert the weight to the right data type
cats$weight <- ______________(cats$weight)
# Calculate the mean to test yourself
mean(cats$weight)
# If you see the correct mean value (and not NA), you did the exercise
# correctly!2. Overview of the data types
The data type of your data is as important as the data itself. Use a
function we saw earlier to print out the data types of all columns of
the cats table.
In the chapter “Data types” we saw two functions that can show data types. One printed just a single word, the data type name. The other printed a short form of the data type, and the first few values. We need the second here.
チャレンジ1 (continued)
Scroll up to the section about the type hierarchy to review the available data types
- Weight is expressed on a continuous scale (real numbers). The R data type for this is “double” (also known as “numeric”).
- The fourth row has the value “2.3 or 2.4”. That is not a number but two, and an english word. Therefore, the “character” data type is chosen. The whole column is now text, because all values in the same columns have to be the same data type.
4. Correct the problematic value
The code to assign a new weight value to the problematic fourth row is given. Think first and then execute it: What will be the data type after assigning a number like in this example? You can check the data type after executing to see if you were right.
Revisit the hierarchy of data types when two different data types are combined.
チャレンジ1 (continued)
チャレンジ8の解答 1.
The data type of the column “weight” is “character”. The assigned data type is “double”. Combining two data types yields the data type that is higher in the following hierarchy:
logical < integer < double < complex < characterTherefore, the column is still of type character! We need to manually convert it to “double”. {: .solution}
The functions to convert data types start with as.. You
can look for the function further up in the manuscript or use the
RStudio auto-complete function: Type “as.” and then press
the TAB key.
チャレンジ1 (continued)
チャレンジ3の解答
There are two functions that are synonymous for historic reasons:
cats$weight <- as.double(cats$weight) cats$weight <- as.numeric(cats$weight)
Some basic vector functions
合成関数
c()は、既存のベクトルに追加することもできます:
R
ab_vector <- c('a', 'b')
ab_vector
出力
[1] "a" "b"R
combine_example <- c(ab_vector, 'SWC')
combine_example
出力
[1] "a" "b" "SWC"数列を作ることもできます:
R
mySeries <- 1:10
mySeries
出力
[1] 1 2 3 4 5 6 7 8 9 10R
seq(10)
出力
[1] 1 2 3 4 5 6 7 8 9 10R
seq(1,10, by=0.1)
出力
[1] 1.0 1.1 1.2 1.3 1.4 1.5 1.6 1.7 1.8 1.9 2.0 2.1 2.2 2.3 2.4
[16] 2.5 2.6 2.7 2.8 2.9 3.0 3.1 3.2 3.3 3.4 3.5 3.6 3.7 3.8 3.9
[31] 4.0 4.1 4.2 4.3 4.4 4.5 4.6 4.7 4.8 4.9 5.0 5.1 5.2 5.3 5.4
[46] 5.5 5.6 5.7 5.8 5.9 6.0 6.1 6.2 6.3 6.4 6.5 6.6 6.7 6.8 6.9
[61] 7.0 7.1 7.2 7.3 7.4 7.5 7.6 7.7 7.8 7.9 8.0 8.1 8.2 8.3 8.4
[76] 8.5 8.6 8.7 8.8 8.9 9.0 9.1 9.2 9.3 9.4 9.5 9.6 9.7 9.8 9.9
[91] 10.0ベクトルについて、いくつか質問することもできます:
R
sequence_example <- 20:25
head(sequence_example, n=2)
出力
[1] 20 21R
tail(sequence_example, n=4)
出力
[1] 22 23 24 25R
length(sequence_example)
出力
[1] 6R
typeof(sequence_example)
出力
[1] "integer"We can get individual elements of a vector by using the bracket notation:
R
first_element <- sequence_example[1]
first_element
出力
[1] 20To change a single element, use the bracket on the other side of the arrow:
R
sequence_example[1] <- 30
sequence_example
出力
[1] 30 21 22 23 24 25チャレンジ2
Start by making a vector with the numbers 1 through 26. Then, multiply the vector by 2.
R
x <- 1:26
x <- x * 2
リスト
覚えておきたいもう一つのデータ構造は、 list です。
リストは、他の種類よりも、ある意味シンプルです。その理由は、入れたいものを
なんでも入れることができるからです: Remember everything in the
vector must be of the same basic data type, but a list can have
different data types:
R
list_example <- list(1, "a", TRUE, 1+4i)
list_example
出力
[[1]]
[1] 1
[[2]]
[1] "a"
[[3]]
[1] TRUE
[[4]]
[1] 1+4iWhen printing the object structure with str(), we see
the data types of all elements:
R
str(list_example)
出力
List of 4
$ : num 1
$ : chr "a"
$ : logi TRUE
$ : cplx 1+4iWhat is the use of lists? They can organize data of different types. For example, you can organize different tables that belong together, similar to spreadsheets in Excel. But there are many other uses, too.
We will see another example that will maybe surprise you in the next chapter.
To retrieve one of the elements of a list, use the double bracket:
R
list_example[[2]]
出力
[1] "a"The elements of lists also can have names, they can be given by prepending them to the values, separated by an equals sign:
R
another_list <- list(title = "Numbers", numbers = 1:10, data = TRUE )
another_list
出力
$title
[1] "Numbers"
$numbers
[1] 1 2 3 4 5 6 7 8 9 10
$data
[1] TRUEThis results in a named list. Now we have a new function of our object! We can access single elements by an additional way!
R
another_list$title
出力
[1] "Numbers"Names
With names, we can give meaning to elements. It is the first time that we do not only have the data, but also explaining information. It is metadata that can be stuck to the object like a label. In R, this is called an attribute. Some attributes enable us to do more with our object, for example, like here, accessing an element by a self-defined name.
Accessing vectors and lists by name
We have already seen how to generate a named list. The way to generate a named vector is very similar. You have seen this function before:
R
pizza_price <- c( pizzasubito = 5.64, pizzafresh = 6.60, callapizza = 4.50 )
The way to retrieve elements is different, though:
R
pizza_price["pizzasubito"]
出力
pizzasubito
5.64 The approach used for the list does not work:
R
pizza_price$pizzafresh
エラー
Error in pizza_price$pizzafresh: $ operator is invalid for atomic vectorsIt will pay off if you remember this error message, you will meet it in your own analyses. It means that you have just tried accessing an element like it was in a list, but it is actually in a vector.
Accessing and changing names
If you are only interested in the names, use the names()
function:
R
names(pizza_price)
出力
[1] "pizzasubito" "pizzafresh" "callapizza" We have seen how to access and change single elements of a vector. The same is possible for names:
R
names(pizza_price)[3]
出力
[1] "callapizza"R
names(pizza_price)[3] <- "call-a-pizza"
pizza_price
出力
pizzasubito pizzafresh call-a-pizza
5.64 6.60 4.50 チャレンジ3
- What is the data type of the names of
pizza_price? You can find out using thestr()ortypeof()functions.
You get the names of an object by wrapping the object name inside
names(...). Similarly, you get the data type of the names
by again wrapping the whole code in typeof(...):
typeof(names(pizza))alternatively, use a new variable if this is easier for you to read:
n <- names(pizza)
typeof(n)チャレンジ4
Instead of just changing some of the names a vector/list already has, you can also set all names of an object by writing code like (replace ALL CAPS text):
names( OBJECT ) <- CHARACTER_VECTORCreate a vector that gives the number for each letter in the alphabet!
- Generate a vector called
letter_nowith the sequence of numbers from 1 to 26! - R has a built-in object called
LETTERS. It is a 26-character vector, from A to Z. Set the names of the number sequence to this 26 letters - Test yourself by calling
letter_no["B"], which should give you the number 2!
letter_no <- 1:26 # or seq(1,26)
names(letter_no) <- LETTERS
letter_no["B"]データフレーム
We have data frames at the very beginning of this lesson, they represent a table of data. We didn’t go much further into detail with our example cat data frame:
R
cats
出力
coat weight likes_string
1 calico 2.1 TRUE
2 black 5.0 FALSE
3 tabby 3.2 TRUEこれで、data.frameの驚くべき特徴を理解することができます。もし以下を走らせたらどうなるでしょう:
R
typeof(cats)
出力
[1] "list"We see that data.frames look like lists ‘under the hood’. Think again what we heard about what lists can be used for:
Lists organize data of different types
Columns of a data frame are vectors of different types, that are organized by belonging to the same table.
A data.frame is really a list of vectors. つまり、 `` は、全てのベクトルの長さが同じでなければならない特別なリストなのです。
How is this “special”-ness written into the object, so that R does not treat it like any other list, but as a table?
R
class(cats)
出力
[1] "data.frame"A class, just like names, is an attribute attached to the object. It tells us what this object means for humans.
You might wonder: Why do we need another
what-type-of-object-is-this-function? We already have
typeof()? That function tells us how the object is
constructed in the computer. The class is
the meaning of the object for humans. Consequently,
what typeof() returns is fixed in R (mainly the
five data types), whereas the output of class() is
diverse and extendable by R packages.
我々の cats
の例では、整数型(integer)、浮動小数型(double)、論理型(logical)の変数があります。
既に見たように、data.frame のそれぞれの列はベクトルです。
R
cats$coat
出力
[1] "calico" "black" "tabby" R
cats[,1]
出力
[1] "calico" "black" "tabby" R
typeof(cats[,1])
出力
[1] "character"R
str(cats[,1])
出力
chr [1:3] "calico" "black" "tabby"それぞれの行は、異なる変数の observation(観測値) であり、それ自体が data.frame であるため、 異なる種類の要素で構成されることができます。
R
cats[1,]
出力
coat weight likes_string
1 calico 2.1 TRUER
typeof(cats[1,])
出力
[1] "list"R
str(cats[1,])
出力
'data.frame': 1 obs. of 3 variables:
$ coat : chr "calico"
$ weight : num 2.1
$ likes_string: logi TRUEチャレンジ5
There are several subtly different ways to call variables, observations and elements from data.frames:
cats[1]cats[[1]]cats$coatcats["coat"]cats[1, 1]cats[, 1]cats[1, ]
Try out these examples and explain what is returned by each one.
Hint: Use the function typeof() to examine what
is returned in each case.
R
cats[1]
出力
coat
1 calico
2 black
3 tabbyWe can think of a data frame as a list of vectors. The single brace
[1] returns the first slice of the list, as another list.
In this case it is the first column of the data frame.
R
cats[[1]]
出力
[1] "calico" "black" "tabby" The double brace [[1]] returns the contents of the list
item. In this case it is the contents of the first column, a
vector of type character.
R
cats$coat
出力
[1] "calico" "black" "tabby" This example uses the $ character to address items by
name. coat is the first column of the data frame, again a
vector of type character.
R
cats["coat"]
出力
coat
1 calico
2 black
3 tabbyHere we are using a single brace ["coat"] replacing the
index number with the column name. Like example 1, the returned object
is a list.
R
cats[1, 1]
出力
[1] "calico"This example uses a single brace, but this time we provide row and column coordinates. The returned object is the value in row 1, column 1. The object is a vector of type character.
R
cats[, 1]
出力
[1] "calico" "black" "tabby" Like the previous example we use single braces and provide row and column coordinates. The row coordinate is not specified, R interprets this missing value as all the elements in this column and returns them as a vector.
R
cats[1, ]
出力
coat weight likes_string
1 calico 2.1 TRUEAgain we use the single brace with row and column coordinates. The column coordinate is not specified. The return value is a list containing all the values in the first row.
Tip: Renaming data frame columns
Data frames have column names, which can be accessed with the
names() function.
R
names(cats)
出力
[1] "coat" "weight" "likes_string"If you want to rename the second column of cats, you can
assign a new name to the second element of names(cats).
R
names(cats)[2] <- "weight_kg"
cats
出力
coat weight_kg likes_string
1 calico 2.1 TRUE
2 black 5.0 FALSE
3 tabby 3.2 TRUE行列
Last but not least is the matrix. We can declare a matrix full of zeros:
R
matrix_example <- matrix(0, ncol=6, nrow=3)
matrix_example
出力
[,1] [,2] [,3] [,4] [,5] [,6]
[1,] 0 0 0 0 0 0
[2,] 0 0 0 0 0 0
[3,] 0 0 0 0 0 0What makes it special is the dim() attribute:
R
dim(matrix_example)
出力
[1] 3 6そして、他のデータ構造と同様に、行列に関することを尋ねることもできます:
R
typeof(matrix_example)
出力
[1] "double"R
class(matrix_example)
出力
[1] "matrix" "array" R
str(matrix_example)
出力
num [1:3, 1:6] 0 0 0 0 0 0 0 0 0 0 ...R
nrow(matrix_example)
出力
[1] 3R
ncol(matrix_example)
出力
[1] 6チャレンジ6
What do you think will be the result of
length(matrix_example)? Try it. Were you right? Why / why
not?
What do you think will be the result of
length(matrix_example)?
R
matrix_example <- matrix(0, ncol=6, nrow=3)
length(matrix_example)
出力
[1] 18Because a matrix is a vector with added dimension attributes,
length gives you the total number of elements in the
matrix.
チャレンジ7
もう一つ行列を作ってみましょう、今回は、1:50の数を含むもので、
5行、10列を持つ行列にしましょう。 この matrix
関数は、デフォルトでは、行か列、どちらから 行列を埋めましたか?
これがどう変化したか理解したか確認してみましょう。 (hint: read the
documentation for matrix!)
もう一つ行列を作ってみましょう、今回は、1:50の数を含むもので、
5行、10列を持つ行列にしましょう。 この matrix
関数は、デフォルトでは、行か列、どちらから 行列を埋めましたか?
これがどう変化したか理解したか確認してみましょう。 (hint: read the
documentation for matrix!)
R
x <- matrix(1:50, ncol=5, nrow=10)
x <- matrix(1:50, ncol=5, nrow=10, byrow = TRUE) # to fill by row
チャレンジ8
ワークショップの現パート、それぞれのセクションのために、二つの文字型ベクトルが含まれるリストを作って下さい:
データ型
Data structures
データ型 - データ構造 それぞれの文字ベクトルをこれまでみてきたデータ型と データ構造で埋めてください。
R
dataTypes <- c('double', 'complex', 'integer', 'character', 'logical')
dataStructures <- c('data.frame', 'vector', 'list', 'matrix')
answer <- list(dataTypes, dataStructures)
Note: it’s nice to make a list in big writing on the board or taped to the wall listing all of these types and structures - leave it up for the rest of the workshop to remind people of the importance of these basics.
チャレンジ8
Consider the R output of the matrix below:
出力
[,1] [,2]
[1,] 4 1
[2,] 9 5
[3,] 10 7この行列を書くために使ったコマンドは何でしたか? それぞれのコマンドを確かめて、打ち込む前に正しいものが何か分かるようにしましょう。 他のコマンドでは、どのような行列が作られるかを考えてみましょう。
matrix(c(4, 1, 9, 5, 10, 7), nrow = 3)matrix(c(4, 9, 10, 1, 5, 7), ncol = 2, byrow = TRUE)matrix(c(4, 9, 10, 1, 5, 7), nrow = 2)matrix(c(4, 1, 9, 5, 10, 7), ncol = 2, byrow = TRUE)
Consider the R output of the matrix below:
出力
[,1] [,2]
[1,] 4 1
[2,] 9 5
[3,] 10 7この行列を書くために使ったコマンドは何でしたか? それぞれのコマンドを確かめて、打ち込む前に正しいものが何か分かるようにしましょう。 他のコマンドでは、どのような行列が作られるかを考えてみましょう。
R
matrix(c(4, 1, 9, 5, 10, 7), ncol = 2, byrow = TRUE)
- Use
read.csvto read tabular data in R. - The basic data types in R are double, integer, complex, logical, and character.
- Data structures such as data frames or matrices are built on top of lists and vectors, with some added attributes.
Content from Exploring Data Frames
最終更新日:2025-11-11 | ページの編集
概要
質問
- How can I manipulate a data frame?
目的
- Add and remove rows or columns.
- データフレームへの追加.
- Display basic properties of data frames including size and class of the columns, names, and first few rows.
At this point, you’ve seen it all: in the last lesson, we toured all the basic data types and data structures in R. Everything you do will be a manipulation of those tools. しかし大抵の場合、主役はデータフレーム(CSVファイルから情報を読み込み作成した表)です。 このレッスンでは、データフレームを使ってどう作業していくかについて更に学んでいきましょう。
データフレームに行と列を追加する
既に学んだとおり、データフレームの列はベクトルですから、列にあるデータには一貫性があります。 ですので、新しい列を加えたい場合は、新しいベクトルを作ることから始めることになります:
R
age <- c(2, 3, 5)
cats
出力
    coat weight likes_string
1 calico    2.1            1
2  black    5.0            0
3 tabby 3.2 1そして、これを以下を使って列に加えます:
R
cbind(cats, age)
出力
coat weight likes_string age
1 calico 2.1 1 2
2 black 5.0 0 3
3 tabby 3.2 1 5もし、データフレームの行の数と一致しない年齢のベクトルを追加しようとすると、失敗します:
R
age <- c(2, 3, 5, 12)
cbind(cats, age)
エラー
Error in data.frame(..., check.names = FALSE): arguments imply differing number of rows: 3, 4R
age <- c(2, 3)
cbind(cats, age)
エラー
Error in data.frame(..., check.names = FALSE): arguments imply differing number of rows: 3, 2Why didn’t this work? なぜダメだったのでしょうか?もちろん、Rは新しい列のひとつの要素を、表の中にある全ての行について参照したがるものです。
R
nrow(cats)
出力
[1] 3R
length(age)
出力
[1] 2So for it to work we need to have nrow(cats) =
length(age). Let’s overwrite the content of cats with our
new data frame.
R
age <- c(2, 3, 5)
cats <- cbind(cats, age)
Now how about adding rows? We already know that the rows of a data frame are lists:
R
newRow <- list("tortoiseshell", 3.3, TRUE, 9)
cats <- rbind(cats, newRow)
Let’s confirm that our new row was added correctly.
R
cats
出力
coat weight likes_string age
1 calico 2.1 1 2
2 black 5.0 0 3
3 tabby 3.2 1 5
4 tortoiseshell 3.3 1 9行の削除
We now know how to add rows and columns to our data frame in R. Now let’s learn to remove rows.
R
cats
出力
coat weight likes_string age
1 calico 2.1 1 2
2 black 5.0 0 3
3 tabby 3.2 1 5
4 tortoiseshell 3.3 1 9この問題の行を除くようにデータフレームに頼みましょう:
R
cats[-4, ]
出力
coat weight likes_string age
1 calico 2.1 1 2
2 black 5.0 0 3
3 tabby 3.2 1 5コンマの後に何もないのは、4番目の行の全部を削除して欲しいということを示している点に留意しましょう。
注意:ベクトルの中に行番号を入れれば、新しく追加した行を両方削除することもできす:cats[c(-3,-4), ]
列の削除
We can also remove columns in our data frame. What if we want to remove the column “age”. We can remove it in two ways, by variable number or by index.
R
cats[,-4]
出力
    coat weight likes_string
1 calico    2.1            1
2  black    5.0            0
3  tabby    3.2            1
4 tortoiseshell 3.3 1全ての行を持っていたいということを示すため、コンマの前に何も入っていない点に留意しましょう。
または、要素番号の名前を使って列を削除することもできます: The
%in% operator goes through each element of its left
argument, in this case the names of cats, and asks, “Does
this element occur in the second argument?”
R
drop <- names(cats) %in% c("age")
cats[,!drop]
出力
coat weight likes_string
1 calico 2.1 1
2 black 5.0 0
3 tabby 3.2 1
4 tortoiseshell 3.3 1We will cover subsetting with logical operators like
%in% in more detail in the next episode. See the section Subsetting through other logical
operations
データフレームへの追加
データフレームにデータを加えるときに覚えておくべき重要なことは、
列はベクトルで、行はリスト であることです。 2つのデータフレームを
rbind を使ってくっつけることもできます:
R
cats <- rbind(cats, cats)
cats
出力
    coat weight likes_string age
1 calico    2.1            1   2
2  black    5.0            0   3
3  tabby    3.2            1   5
4 tortoiseshell 3.3 1 9
5 calico 2.1 1 2
6 black 5.0 0 3
7 tabby 3.2 1 5
8 tortoiseshell 3.3 1 9チャレンジ1
You can create a new data frame right from within R with the following syntax:
R
df <- data.frame(id = c("a", "b", "c"),
                 x = 1:3,
                 y = c(TRUE, TRUE, FALSE))
Make a data frame that holds the following information for yourself:
- first name
- last name
- lucky number
Then use rbind to add an entry for the people sitting
beside you. Finally, use cbind to add a column with each
person’s answer to the question, “Is it time for coffee break?”
R
df <- data.frame(first = c("Grace"),
                 last = c("Hopper"),
                 lucky_number = c(0))
df <- rbind(df, list("Marie", "Curie", 238) )
df <- cbind(df, coffeetime = c(TRUE,TRUE))
現実的な例
So far, you have seen the basics of manipulating data frames with our
cat data; now let’s use those skills to digest a more realistic dataset.
Let’s read in the gapminder dataset that we downloaded
previously:
R
gapminder <- read.csv("data/gapminder_data.csv")
いろいろなヒント
Another type of file you might encounter are tab-separated value files (.tsv). To specify a tab as a separator, use
"\\t"orread.delim().Files can also be downloaded directly from the Internet into a local folder of your choice onto your computer using the
download.filefunction. Theread.csvfunction can then be executed to read the downloaded file from the download location, for example,
R
download.file("https://raw.githubusercontent.com/swcarpentry/r-novice-gapminder/main/episodes/data/gapminder_data.csv", destfile = "data/gapminder_data.csv")
gapminder <- read.csv("data/gapminder_data.csv")
- Alternatively, you can also read in files directly into R from the
Internet by replacing the file paths with a web address in
read.csv. One should note that in doing this no local copy of the csv file is first saved onto your computer. 例えば:
R
gapminder <- read.csv("https://raw.githubusercontent.com/swcarpentry/r-novice-gapminder/main/episodes/data/gapminder_data.csv")
You can read directly from excel spreadsheets without converting them to plain text first by using the readxl package.
The argument “stringsAsFactors” can be useful to tell R how to read strings either as factors or as character strings. In R versions after 4.0, all strings are read-in as characters by default, but in earlier versions of R, strings are read-in as factors by default. For more information, see the call-out in the previous episode.
gapminderを少し見てみましょう。いつも、まずしなければいけないことは、
データがどうなっているかをstrで見てみることです:
R
str(gapminder)
出力
'data.frame':	1704 obs. of  6 variables:
 $ country  : chr  "Afghanistan" "Afghanistan" "Afghanistan" "Afghanistan" ...
 $ year     : int  1952 1957 1962 1967 1972 1977 1982 1987 1992 1997 ...
 $ pop      : num  8425333 9240934 10267083 11537966 13079460 ...
 $ continent: chr  "Asia" "Asia" "Asia" "Asia" ...
 $ lifeExp  : num  28.8 30.3 32 34 36.1 ...
 $ gdpPercap: num  779 821 853 836 740 ...
An additional method for examining the structure of gapminder is to
use the summary function. This function can be used on
various objects in R. For data frames, summary yields a
numeric, tabular, or descriptive summary of each column. Numeric or
integer columns are described by the descriptive statistics (quartiles
and mean), and character columns by its length, class, and mode.
R
summary(gapminder)
出力
   country               year           pop             continent
 Length:1704        Min.   :1952   Min.   :6.001e+04   Length:1704
 Class :character   1st Qu.:1966   1st Qu.:2.794e+06   Class :character
 Mode  :character   Median :1980   Median :7.024e+06   Mode  :character
                    Mean   :1980   Mean   :2.960e+07
                    3rd Qu.:1993   3rd Qu.:1.959e+07
                    Max.   :2007   Max.   :1.319e+09
    lifeExp        gdpPercap
 Min.   :23.60   Min.   :   241.2
 1st Qu.:48.20   1st Qu.:  1202.1
 Median :60.71   Median :  3531.8
 Mean   :59.47   Mean   :  7215.3
 3rd Qu.:70.85   3rd Qu.:  9325.5
 Max.   :82.60   Max.   :113523.1
Along with the str and summary functions,
we can examine individual columns of the data frame with our
typeof function:
R
typeof(gapminder$year)
出力
[1] "integer"R
typeof(gapminder$country)
出力
[1] "character"R
str(gapminder$country)
出力
chr [1:1704] "Afghanistan" "Afghanistan" "Afghanistan" "Afghanistan" ...データフレームの次元について見てみることもできます。
str(gapminder)
が、gapminderには、6変数について1704の観測値があると言っていたことを念頭に置き、
以下から何が出てくると思いますか?それはなぜですか?
R
length(gapminder)
出力
[1] 6予想としては、データフレームの長さは行数(1704)だと思うものですが、実はそうではありません。 データフレームは、 ベクトルと順序なし因子型のリストである ということを思い出しましょう:
R
typeof(gapminder)
出力
[1] "list"lengthが、6と返ってくるのは、gapminderは、6つの列のリストから成っているからです。
データセットで、行と列の数を知るためには、こうしてみましょう:
R
nrow(gapminder)
出力
[1] 1704R
ncol(gapminder)
出力
[1] 6または、両方を同時に:
R
dim(gapminder)
出力
[1] 1704 6全ての列のタイトルを知りたいと思うことも多いと思うので、後で聞いてみましょう:
R
colnames(gapminder)
出力
[1] "country" "year" "pop" "continent" "lifeExp" "gdpPercap"この段階で、Rが伝える構造が自分の直感や予想と合っているかを自問することが大切です。 それぞれの列の基本的なデータ型は、思った通りのデータ型になってますか?もしなっていないのなら、今後、予想外の事態を引き起こさないように、 今の時点で、問題を解決しておく必要があります。そのためには、これまでに学んだ、Rがどのようにデータを解釈するか、 そしてデータを記録する際の 厳格な整合性 の重要性といった知識を活かしましょう。
データ型と構造に満足することができたら、データを詳しく見始めることができます。 最初のいくつかの行を見てみましょう:
R
head(gapminder)
出力
      country year      pop continent lifeExp gdpPercap
1 Afghanistan 1952  8425333      Asia  28.801  779.4453
2 Afghanistan 1957  9240934      Asia  30.332  820.8530
3 Afghanistan 1962 10267083      Asia  31.997  853.1007
4 Afghanistan 1967 11537966      Asia  34.020  836.1971
5 Afghanistan 1972 13079460      Asia  36.088  739.9811
6 Afghanistan 1977 14880372 Asia 38.438 786.1134チャレンジ2
It’s good practice to also check the last few lines of your data and some in the middle. How would you do this?
Searching for ones specifically in the middle isn’t too hard, but we could ask for a few lines at random. How would you code this?
To check the last few lines it’s relatively simple as R already has a function for this:
R
tail(gapminder)
tail(gapminder, n = 15)
What about a few arbitrary rows just in case something is odd in the middle?
Tip: There are several ways to achieve this.
The solution here presents one form of using nested functions, i.e. a function passed as an argument to another function. This might sound like a new concept, but you are already using it! Remember my_dataframe[rows, cols] will print to screen your data frame with the number of rows and columns you asked for (although you might have asked for a range or named columns for example). How would you get the last row if you don’t know how many rows your data frame has? R has a function for this. What about getting a (pseudorandom) sample? R also has a function for this.
R
gapminder[sample(nrow(gapminder), 5), ]
分析を再現可能にするためには、後で使えるようにコードをスクリプトファイルに置く必要があります。
チャレンジ3
Go to file -> new file -> R script, and write an R script to
load in the gapminder dataset. Put it in the scripts/
directory and add it to version control.
Run the script using the source function, using the file
path as its argument (or by pressing the “source” button in
RStudio).
The source function can be used to use a script within a
script. Assume you would like to load the same type of file over and
over again and therefore you need to specify the arguments to fit the
needs of your file. Instead of writing the necessary argument again and
again you could just write it once and save it as a script. Then, you
can use source("Your_Script_containing_the_load_function")
in a new script to use the function of that script without writing
everything again. Check out ?source to find out more.
R
download.file("https://raw.githubusercontent.com/swcarpentry/r-novice-gapminder/main/episodes/data/gapminder_data.csv", destfile = "data/gapminder_data.csv")
gapminder <- read.csv(file = "data/gapminder_data.csv")
To run the script and load the data into the gapminder
variable:
R
source(file = "scripts/load-gapminder.R")
チャレンジ4
str(gapminder) の結果を再び読みましょう。
今度は、順序なし因数、リスト、ベクトルについて学んだことを使いましょう。
The object gapminder is a data frame with columns
-
countryandcontinentare character strings. - 理解できないところがあれば、近くの人と話し合ってみましょう。
- チャレンジ5の解答
gapminderというオブジェクトは、データフレームで、 -countryとcontinentという順序なし因子型、 -yearという整数型のベクトル、 -pop、lifeExp、gdpPercapという数値型のベクトルの行を持っています。
- Use
cbind()to add a new column to a data frame. - Use
rbind()to add a new row to a data frame. - Remove rows from a data frame.
- Use
str(),summary(),nrow(),ncol(),dim(),colnames(),head(), andtypeof()to understand the structure of a data frame. - Read in a csv file using
read.csv(). - Understand what
length()of a data frame represents.
Content from Subsetting Data
最終更新日:2025-11-11 | ページの編集
概要
質問
- How can I work with subsets of data in R?
目的
- To be able to subset vectors, factors, matrices, lists, and data frames
- To be able to extract individual and multiple elements: by index, by name, using comparison operations
- To be able to skip and remove elements from various data structures.
R has many powerful subset operators. Mastering them will allow you to easily perform complex operations on any kind of dataset.
オブジェクトを部分集合する方法は6つあり、データ構造を 部分集合する方法は3つあります。
Rの働き頭、数値ベクトルから始めましょう。
R
x <- c(5.4, 6.2, 7.1, 4.8, 7.5)
names(x) <- c('a', 'b', 'c', 'd', 'e')
x
出力
  a   b   c   d   e
5.4 6.2 7.1 4.8 7.5 原子ベクトル
Rでは、文字列、数値、論理値を含む単純なベクトルは、 原子(atomic) ベクトルと呼ばれています。その理由は、原子ベクトルはそれ以上単純化できないからです。
練習用のベクトルを作ることができたのですが、どうやってベクトルの中身を使うのでしょう?
要素番号で要素を使う
ベクトルの要素を抽出するためには、対応する1から始まる要素番号を使います:
R
x[1]
出力
  a
5.4
R
x[4]
出力
  d
4.8
It may look different, but the square brackets operator is a function. For vectors (and matrices), it means “get me the nth element”.
複数の要素を一度に頼むこともできます:
R
x[c(1, 3)]
出力
  a   c
5.4 7.1
または、ベクトルのスライスを頼むこともできます:
R
x[1:4]
出力
  a   b   c   d
5.4 6.2 7.1 4.8
この :
演算子は、左から右の要素の一連番号を作ります。
R
1:4
出力
[1] 1 2 3 4R
c(1, 2, 3, 4)
出力
[1] 1 2 3 4同じ要素を何度も頼むこともできます:
R
x[c(1,1,3)]
出力
  a   a   c
5.4 5.4 7.1
もしベクトルの長さ以上の要素番号を頼んだ場合、Rは欠測値を返します:
R
x[6]
出力
<NA>
  NA
これは、 NA を含む、NA
という名前の長さ1のベクトルです。
もし、0番目の要素を頼んだ場合、空ベクトルが返ってきます:
R
x[0]
出力
named numeric(0)Rのベクトル番号は、1から始まる
多くのプログラミング言語(例えば、C、Python)では、ベクトルの最初の 要素の要素番号は0です。Rでは、最初の要素番号は1です。 In R, the first element is 1.
要素を飛ばす、削除する
もし、負の番号をベクトルの要素番号として使った場合、Rは指定された番号 以外の 全ての要素を返します:
R
x[-2]
出力
  a   c   d   e
5.4 7.1 4.8 7.5
複数の要素を飛ばすこともできます:
R
x[c(-1, -5)] # or x[-c(1,5)]
出力
  b   c   d
6.2 7.1 4.8 ヒント:演算の順番
初心者によく見られるのが、ベクトルのスライスを飛ばそうとする時に起こる間違いです。 It’s natural to try to negate a sequence like so:
R
x[-1:3]
This gives a somewhat cryptic error:
エラー
Error in x[-1:3]: only 0's may be mixed with negative subscripts演算の順番を思い出してみましょう。:
は、実際には関数なのです。
最初の引数を-1、次の引数を3として認識し、次のような数列を生成します。
c(-1, 0, 1, 2, 3)
正解は、関数を呼ぶ部分を括弧で囲むことです。
そうすると関数の結果全てに- の演算子が適応されます: ~~~
x[-(:)] ~~~ ~~~ d e:
R
x[-(1:3)]
出力
  d   e
4.8 7.5
ベクトルから要素を削除するには、結果を変数に戻してやる必要があります。
R
x <- x[-4]
x
出力
  a   b   c   e
5.4 6.2 7.1 7.5 チャレンジ1
以下のリストがあるとします:
R
x <- c(5.4, 6.2, 7.1, 4.8, 7.5)
names(x) <- c('a', 'b', 'c', 'd', 'e')
print(x)
出力
  a   b   c   d   e
5.4 6.2 7.1 4.8 7.5
以下の出力を得るために、少なくとも2つの異なるコマンドを考えてください: ~~~ b c d:
出力
  b   c   d
6.2 7.1 4.8
After you find 2 different commands, compare notes with your neighbour. Did you have different strategies?
R
x[2:4]
出力
  b   c   d
6.2 7.1 4.8
R
x[-c(1,5)]
出力
  b   c   d
6.2 7.1 4.8
R
x[c(2,3,4)]
出力
  b   c   d
6.2 7.1 4.8
名前で部分集合を作る
要素番号で抜き出す代わりに、名前で要素を抽出することもできます。
R
x <- c(a=5.4, b=6.2, c=7.1, d=4.8, e=7.5) # ベクトルを'その場で'名づけることができます x[c("a", "c")]
オブジェクトの部分集合を作るには、この方法の方が確実です:要素の場所は、 部分集合の演算子を繋いで使うことでよく変わるのですが、 名前は絶対に変わりません。
Subsetting through other logical operations
どんな論理ベクトルでも部分集合を作ることができます:
R
x[c(FALSE, FALSE, TRUE, FALSE, TRUE)]
出力
  c   e
7.1 7.5
つまり、以下の宣言は、前と同じ結果を返します。
R
x[x > 7]
出力
  c   e
7.1 7.5
分割すると、この宣言は最初に x 7 を計算し、論理ベクトル
c(FALSE, FALSE, TRUE, FALSE, TRUE) を作ります。それから、
TRUE の値に対応する要素を x
から選択しています。
名前で特定するという既出の方法を真似するため、 ==
を使うこともできます。 (比較には、 = ではなく、
== を使わないといけません):
R
x[names(x) == "a"]
出力
  a
5.4 ヒント:論理条件を組み合わせる
We often want to combine multiple logical criteria. For example, we might want to find all the countries that are located in Asia or Europe and have life expectancies within a certain range. Several operations for combining logical vectors exist in R:
-
&, the “logical AND” operator: returnsTRUEif both the left and right areTRUE. -
|, the “logical OR” operator: returnsTRUE, if either the left or right (or both) areTRUE.
You may sometimes see && and ||
instead of & and |. These two-character
operators only look at the first element of each vector and ignore the
remaining elements. In general you should not use the two-character
operators in data analysis; save them for programming, i.e. deciding
whether to execute a statement.
-
!, the “logical NOT” operator: convertsTRUEtoFALSEandFALSEtoTRUE. It can negate a single logical condition (eg!TRUEbecomesFALSE), or a whole vector of conditions(eg!c(TRUE, FALSE)becomesc(FALSE, TRUE)).
Additionally, you can compare the elements within a single vector
using the all function (which returns TRUE if
every element of the vector is TRUE) and the
any function (which returns TRUE if one or
more elements of the vector are TRUE).
チャレンジ2
以下のリストがあるとします:
R
x <- c(5.4, 6.2, 7.1, 4.8, 7.5)
names(x) <- c('a', 'b', 'c', 'd', 'e')
print(x)
出力
  a   b   c   d   e
5.4 6.2 7.1 4.8 7.5
4よりも大きく7より小さいxの値を返す部分集合を作るコマンドを書きましょう。
R
x_subset <- x[x<7 & x>4]
print(x_subset)
出力
  a   b   d
5.4 6.2 4.8 ヒント:同じ名前がある場合
You should be aware that it is possible for multiple elements in a vector to have the same name. (For a data frame, columns can have the same name — although R tries to avoid this — but row names must be unique.) Consider these examples:
R
x <- 1:3
x
出力
[1] 1 2 3R
names(x) <- c('a', 'a', 'a')
x
出力
a a a
1 2 3
R
x['a'] # only returns first value
出力
a
1
R
x[names(x) == 'a'] # returns all three values
出力
a a a
1 2 3 ヒント:演算子についてのヘルプを見る
演算子を引用符で囲むことで、演算子についてのヘルプを検索できることを覚えておきましょう:
help("%in%") または ?"%in%".
名前のある要素を飛ばす
Skipping or removing named elements is a little harder. 名前のある要素を飛ばしたり削除したりすることは少しだけ難しくなります。もし、ある文字列にマイナス記号を付けて飛ばそうとすると、Rは文字列にマイナス記号を付ける方法を知らないと(若干控えめに)抗議するでしょう:
R
x <- c(a=5.4, b=6.2, c=7.1, d=4.8, e=7.5) # まず、ベクトルにその場で名前を付けることから始めます x[-"a"]
でも、!=
(不等号)演算子を使えば、やってもらいたかったことをしてくれる論理ベクトルが作れます:
R
x[names(x) != "a"]
出力
  b   c   d   e
6.2 7.1 4.8 7.5
Skipping multiple named indices is a little bit harder still. Suppose
we want to drop the "a" and "c" elements, so
we try this:
R
x[names(x)!=c("a","c")]
警告
Warning in names(x) != c("a", "c"): longer object length is not a multiple of
shorter object length
出力
  b   c   d   e
6.2 7.1 4.8 7.5
Rは 何か
をしたのですが、私達が注目しなければならない警告も出しました。結果としては、どうやら
間違った回答 が帰ってきたみたいです("c"
の要素が、ベクトルに含まれています)!
So what does != actually do in this case? That’s an
excellent question.
再利用
このコードの比較する部分を見てみましょう:
R
names(x) != c("a", "c")
警告
Warning in names(x) != c("a", "c"): longer object length is not a multiple of
shorter object length
出力
[1] FALSE TRUE TRUE TRUE TRUERは、names(x)[3] != "c"
が明らかに間違いであるときに、このベクトルの3番目の要素をなぜTRUE
にしたのでしょうか。 !=
を使うとき、Rは左側の引数のそれぞれの要素を右側のそれぞれの要素と比較しようとします。
違う長さのベクトルを比較しようとすると、何が起こるのでしょう?
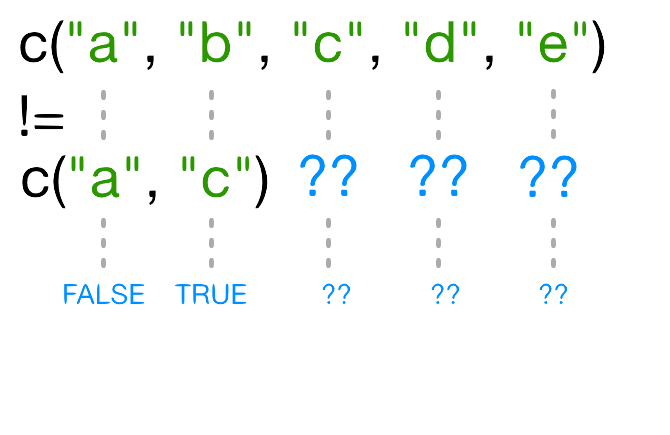
もし、もう一つのベクトルよりも短いベクトルがあったとき、そのベクトルは 再利用されます :
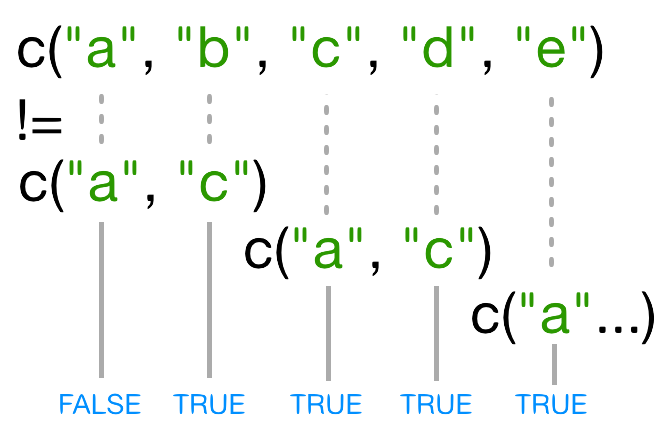
In this case R repeats c("a", "c") as
many times as necessary to match names(x), i.e. we get
c("a","c","a","c","a"). Since the recycled "a"
doesn’t match the third element of names(x), the value of
!= is TRUE. Because in this case the longer
vector length (5) isn’t a multiple of the shorter vector length (2), R
printed a warning message. If we had been unlucky and
names(x) had contained six elements, R would
silently have done the wrong thing (i.e., not what we intended
it to do). This recycling rule can can introduce hard-to-find and subtle
bugs!
The way to get R to do what we really want (match each
element of the left argument with all of the elements of the
right argument) it to use the %in% operator. The
%in% operator goes through each element of its left
argument, in this case the names of x, and asks, “Does this
element occur in the second argument?”. Here, since we want to
exclude values, we also need a ! operator to
change “in” to “not in”:
R
x[! names(x) %in% c("a","c") ]
出力
  b   d   e
6.2 4.8 7.5 チャレンジ3
Selecting elements of a vector that match any of a list of components
is a very common data analysis task. For example, the gapminder data set
contains country and continent variables, but
no information between these two scales. Suppose we want to pull out
information from southeast Asia: how do we set up an operation to
produce a logical vector that is TRUE for all of the
countries in southeast Asia and FALSE otherwise?
Suppose you have these data:
R
seAsia <- c("Myanmar","Thailand","Cambodia","Vietnam","Laos")
## read in the gapminder data that we downloaded in episode 2
gapminder <- read.csv("data/gapminder_data.csv", header=TRUE)
## extract the `country` column from a data frame (we'll see this later);
## convert from a factor to a character;
## and get just the non-repeated elements
countries <- unique(as.character(gapminder$country))
There’s a wrong way (using only ==), which will give you
a warning; a clunky way (using the logical operators == and
|); and an elegant way (using %in%). See
whether you can come up with all three and explain how they (don’t)
work.
- The wrong way to do this problem is
countries==seAsia. This gives a warning ("In countries == seAsia : longer object length is not a multiple of shorter object length") and the wrong answer (a vector of allFALSEvalues), because none of the recycled values ofseAsiahappen to line up correctly with matching values incountry. - The clunky (but technically correct) way to do this problem is
R
 (countries=="Myanmar" | countries=="Thailand" |
 countries=="Cambodia" | countries == "Vietnam" | countries=="Laos")
(or countries==seAsia[1] | countries==seAsia[2] | ...).
This gives the correct values, but hopefully you can see how awkward it
is (what if we wanted to select countries from a much longer list?).
- The best way to do this problem is
countries %in% seAsia, which is both correct and easy to type (and read).
特別な値を扱う
ある時点で、欠測値、無限値、未定義のデータを扱えないRの関数に出会うことでしょう。
データをフィルターするために使える特別な関数がいくつかあります:
-
is.naは、ベクトル、行列、データフレームで、 - likewise,
is.nan, andis.infinitewill do the same forNaNandInf. -
is.finitewill return all positions in a vector, matrix, or data.frame that do not containNA,NaNorInf. -
na.omitwill filter out all missing values from a vector
順序のない因子の部分集合を作る
これまで部分集合ベクトルを作る色々な方法をやってみましたが、 他のデータ構造の部分集合を作るにはどうすればいいでしょう。
順序なし因子の部分集合を作る方法は、ベクトルの部分集合を作る方法と同じです。
R
f <- factor(c("a", "a", "b", "c", "c", "d"))
f[f == "a"]
出力
[1] a a
Levels: a b c d
R
f[f %in% c("b", "c")]
出力
[1] b c c
Levels: a b c d
R
f[1:3]
出力
[1] a a b
Levels: a b c d
要素を飛ばし、その順序なし因子に該当カテゴリーが存在しない場合であっても、水準は削除されません:
R
f[-3]
出力
[1] a a c c d
Levels: a b c d
行列の部分周到を作る
Matrices are also subsetted using the [ function. In
this case it takes two arguments: the first applying to the rows, the
second to its columns:
R
set.seed(1)
m <- matrix(rnorm(6*4), ncol=4, nrow=6)
m[3:4, c(3,1)]
出力
            [,1]       [,2]
[1,]  1.12493092 -0.8356286
[2,] -0.04493361  1.5952808
それぞれ全ての列または行を取ってくるためには、最初または2番目の引数を空のままにしておきましょう:
R
m[, c(3,4)]
出力
            [,1]        [,2]
[1,] -0.62124058  0.82122120
[2,] -2.21469989  0.59390132
[3,]  1.12493092  0.91897737
[4,] -0.04493361  0.78213630
[5,] -0.01619026  0.07456498
[6,]  0.94383621 -1.98935170
1つの列または行にアクセスした場合、Rは結果を自動的にベクトルに変換します:
R
m[3,]
出力
[1] -0.8356286 0.5757814 1.1249309 0.9189774もし、アウトプットを行列のままにしておきたいなら、 3番目の 因数、
drop = FALSE が必要です:
R
m[3, , drop=FALSE]
出力
           [,1]      [,2]     [,3]      [,4]
[1,] -0.8356286 0.5757814 1.124931 0.9189774
ベクトルと違って、行列の外の行や列にアクセスしようとすると、Rはエラーを返します:
R
m[, c(3,6)]
エラー
Error in m[, c(3, 6)]: subscript out of boundsヒント:高次元列
多次元列を扱う際、[
のそれぞれの引数は、次元に対応しています。
例えば、3次元列は、最初の3つの引数が、行、列、次元の深さに対応してます。
行列はベクトルなので、1つの引数だけを使って部分集合を作ることもできます:
R
m[5]
出力
[1] 0.3295078This usually isn’t useful, and often confusing to read. However it is useful to note that matrices are laid out in column-major format by default. That is the elements of the vector are arranged column-wise:
R
matrix(1:6, nrow=2, ncol=3)
出力
     [,1] [,2] [,3]
[1,]    1    3    5
[2,]    2    4    6
もし、行列を行の順番で埋めていきたい場合は、 byrow=TRUE
を使います:
R
matrix(1:6, nrow=2, ncol=3, byrow=TRUE)
出力
     [,1] [,2] [,3]
[1,]    1    2    3
[2,]    4    5    6
行列もまた、行及び列の要素番号の代わりに、名前で部分集合を作ることができます。
チャレンジ4
以下のリストがあるとします:
R
m <- matrix(1:18, nrow=3, ncol=6)
print(m)
出力
     [,1] [,2] [,3] [,4] [,5] [,6]
[1,]    1    4    7   10   13   16
[2,]    2    5    8   11   14   17
[3,] 3 6 9 12 15 18- 次のコマンドのうち、11と14を抜き出すことができるコマンドはどれでしょう?
A. m[2,4,2,5]
B. m[2:5]
C. m[4:5,2]
D. m[2,c(4,5)]
D
リストの分部集合を作る
Now we’ll introduce some new subsetting operators. There are three
functions used to subset lists. We’ve already seen these when learning
about atomic vectors and matrices: [, [[, and
$.
Using [ will always return a list. If you want to
subset a list, but not extract an element, then you
will likely use [.
R
xlist <- list(a = "Software Carpentry", b = 1:10, data = head(mtcars))
xlist[1]
出力
$a
[1] "Software Carpentry"
これは、 1つの要素を持つリスト です。
[
を使って原子ベクトルを作ったのと全く同じ方法で、リストの要素から部分集合を作ることができます。
しかし、比較処理は反復的ではないため、使えません。比較処理は、リストのそれぞれの要素のデータ構造にある、個々の要素ではなく、
データ構造に条件付けをしようとするからです。
R
xlist[1:2]
出力
$a
[1] "Software Carpentry"

$b
 [1]  1  2  3  4  5  6  7  8  9 10
リストの個々の要素を抜き出すためには、二重角括弧 [[
を使う必要があります:
R
xlist[[1]]
出力
[1] "Software Carpentry"ここで結果がリストではなく、ベクトルとなっていることに気をつけましょう。
1つの要素を同時に抜き出すことはできません:
R
xlist[[1:2]]
エラー
Error in xlist[[1:2]]: subscript out of boundsまた、要素を飛ばすこともできません:
R
xlist[[-1]]
エラー
Error in xlist[[-1]]: invalid negative subscript in get1index <real>でも両方の部分集合の名前を使って、要素を抽出することはできます:
R
xlist[["a"]]
出力
[1] "Software Carpentry"$ 関数は、簡単に名前で要素を抽出できるものです。
R
xlist$data
出力
                   mpg cyl disp  hp drat    wt  qsec vs am gear carb
Mazda RX4         21.0   6  160 110 3.90 2.620 16.46  0  1    4    4
Mazda RX4 Wag     21.0   6  160 110 3.90 2.875 17.02  0  1    4    4
Datsun 710        22.8   4  108  93 3.85 2.320 18.61  1  1    4    1
Hornet 4 Drive    21.4   6  258 110 3.08 3.215 19.44  1  0    3    1
Hornet Sportabout 18.7   8  360 175 3.15 3.440 17.02  0  0    3    2
Valiant 18.1 6 225 105 2.76 3.460 20.22 1 0 3 1チャレンジ5
以下のリストがあるとします:
R
xlist <- list(a = "Software Carpentry", b = 1:10, data = head(mtcars))
Using your knowledge of both list and vector subsetting, extract the number 2 from xlist. ヒント:数字の2は、リスト「b」の中にあります。
R
xlist$b[2]
出力
[1] 2R
xlist[[2]][2]
出力
[1] 2R
xlist[["b"]][2]
出力
[1] 2チャレンジ6
以下のような線形モデルあるとします:
R
mod <- aov(pop ~ lifeExp, data=gapminder)
Extract the residual degrees of freedom (hint:
attributes() will help you)
R
attributes(mod) ## `df.residual` is one of the names of `mod`
R
mod$df.residual
データフレーム
データフレームの中身は実はリストなので、リストと同じようなルールがあてはまることを覚えておきましょう。 しかし、データフレームは2次元のオブジェクトでもあります。
1つの引数しかない [
は、リストと同じような働きがあり、それぞれのリストの要素が列に対応します。
その結果、返されるオブジェクトはデータフレームになります:
R
head(gapminder[3])
出力
       pop
1  8425333
2  9240934
3 10267083
4 11537966
5 13079460
6 14880372
同様に、 [[ は、 単一の列
を抜き出す働きをするものです:
R
head(gapminder[["lifeExp"]])
出力
[1] 28.801 30.332 31.997 34.020 36.088 38.438そして $ は、簡単に列名で列を抽出できるものです:
R
head(gapminder$year)
出力
[1] 1952 1957 1962 1967 1972 19772つの引数を使えば、 [
は、行列と同じような働きをします:
R
gapminder[1:3,]
出力
      country year      pop continent lifeExp gdpPercap
1 Afghanistan 1952  8425333      Asia  28.801  779.4453
2 Afghanistan 1957  9240934      Asia  30.332  820.8530
3 Afghanistan 1962 10267083      Asia  31.997  853.1007
もし、1つの行を部分集合する場合、結果はデータフレームになります (理由は、要素には色々なデータ型が混ざっているからです):
R
gapminder[3,]
出力
      country year      pop continent lifeExp gdpPercap
3 Afghanistan 1962 10267083      Asia  31.997  853.1007
しかし、1つの行についての結果は、ベクトルになります
(これは、3番目の引数を drop = FALSE
とすれば変えられます)。
チャレンジ7
Fix each of the following common data frame subsetting errors:
- Extract observations collected for the year 1957
- Extract all columns except 1 through to 4
R
gapminder[,-1:4]
- Extract the rows where the life expectancy is longer the 80 years
R
gapminder[gapminder$lifeExp > 80]
- Extract the first row, and the fourth and fifth columns
(
continentandlifeExp).
R
gapminder[1, 4, 5]
- Advanced: extract rows that contain information for the years 2002 and 2007
R
gapminder[gapminder$year == 2002 | 2007,]
Fix each of the following common data frame subsetting errors:
- Extract observations collected for the year 1957
R
# gapminder[gapminder$year = 1957,]
gapminder[gapminder$year == 1957,]
- Extract all columns except 1 through to 4
R
# gapminder[,-1:4]
gapminder[,-c(1:4)]
- Extract the rows where the life expectancy is longer than 80 years
R
# gapminder[gapminder$lifeExp > 80]
gapminder[gapminder$lifeExp > 80,]
- Extract the first row, and the fourth and fifth columns
(
continentandlifeExp).
R
# gapminder[1, 4, 5]
gapminder[1, c(4, 5)]
- Advanced: extract rows that contain information for the years 2002 and 2007
R
# gapminder[gapminder$year == 2002 | 2007,]
gapminder[gapminder$year == 2002 | gapminder$year == 2007,]
gapminder[gapminder$year %in% c(2002, 2007),]
チャレンジ8
なぜ、
gapminder[1:20]は、エラーを返すのでしょうか?gapminder[1:20, ]とどう違うのでしょう?新しく
gapminder_smallという、1から9の行だけを含むdata.frameを作ってください。 これは、1つまたは2つの手順でできます。
gapminderは、データフレームなので、2つの次元の部分集合を作る必要があります。gapminder[1:20, ]は、最初から20番目の行までについて全ての列を引き出します。
R
gapminder_small <- gapminder[c(1:9, 19:23),]
- Indexing in R starts at 1, not 0.
- Access individual values by location using
[]. - Access slices of data using
[low:high]. - Access arbitrary sets of data using
[c(...)]. - Use logical operations and logical vectors to access subsets of data.
Content from Control Flow
最終更新日:2025-11-11 | ページの編集
概要
質問
- How can I make data-dependent choices in R?
- How can I repeat operations in R?
目的
- Write conditional statements with
if...elsestatements andifelse(). - Write and understand
for()loops.
コードを書く際、実行の流れを制御する必要がよくあります。 これは、ある条件、または一連の条件が満たされたときに実行されるようにすればできます。 あるいは、決まった回数実行されるよう設定することもできます。
There are several ways you can control flow in R. For conditional statements, the most commonly used approaches are the constructs:
R
~~~ # if if (condition is true) {
  perform action
} # if ... else if (condition is true) { # 条件が満たされた場合 アクションを行う } else { # つまり、条件が満たされなかった場合 別のアクションを行う } ~~~
例えばRに、もし変数 x
が特定の値を持っていた場合、メッセージを表示させたいとします。
R
x <- 8

if (x >= 10) {
  print("x is greater than or equal to 10")
}

x
出力
[1] 8The print statement does not appear in the console because x is not
greater than 10. To print a different message for numbers less than 10,
we can add an else statement.
R
x <- 8

if (x >= 10) {
  print("x is greater than or equal to 10")
} else {
  print("x is less than 10")
}
出力
[1] "x is less than 10"else if を使うと、複数の条件を試すこともできます。
R
x <- 8

if (x >= 10) {
  print("x is greater than or equal to 10")
} else if (x > 5) {
  print("x is greater than 5, but less than 10")
} else {
  print("x is less than 5")
}
出力
[1] "x is greater than 5, but less than 10"Important: when R evaluates the condition inside
if() statements, it is looking for a logical element, i.e.,
TRUE or FALSE. This can cause some headaches
for beginners. 例えば:
R
x  <-  4 == 3
if (x) {
  "4 equals 3"
} else {
  "4 does not equal 3"
}
出力
[1] "4 does not equal 3"ここで見られるように、ベクトル x が FALSE
であるため、不等号のメッセージが表示されました。
R
x <- 4 == 3
x
出力
[1] FALSEチャレンジ1
Use an if() statement to print a suitable message
reporting whether there are any records from 2002 in the
gapminder dataset. Now do the same for 2012.
We will first see a solution to Challenge 1 which does not use the
any() function. We first obtain a logical vector describing
which element of gapminder$year is equal to
2002:
R
gapminder[(gapminder$year == 2002),]
Then, we count the number of rows of the data.frame
gapminder that correspond to the 2002:
R
rows2002_number <- nrow(gapminder[(gapminder$year == 2002),])
The presence of any record for the year 2002 is equivalent to the
request that rows2002_number is one or more:
R
rows2002_number >= 1
Putting all together, we obtain:
R
if(nrow(gapminder[(gapminder$year == 2002),]) >= 1){
   print("Record(s) for the year 2002 found.")
}
All this can be done more quickly with any(). The
logical condition can be expressed as:
R
if(any(gapminder$year == 2002)){
   print("Record(s) for the year 2002 found.")
}
次のような警告メッセージをもらった人はいますか?
エラー
Error in if (gapminder$year == 2012) {: the condition has length > 1The if() function only accepts singular (of length 1)
inputs, and therefore returns an error when you use it with a vector.
The if() function will still run, but will only evaluate
the condition in the first element of the vector. Therefore, to use the
if() function, you need to make sure your input is singular
(of length 1).
Tip: Built in ifelse()
function
R accepts both if() and
else if() statements structured as outlined above, but also
statements using R’s built-in ifelse()
function. This function accepts both singular and vector inputs and is
structured as follows:
where the first argument is the condition or a set of conditions to
be met, the second argument is the statement that is evaluated when the
condition is TRUE, and the third statement is the statement
that is evaluated when the condition is FALSE.
R
y <- -3
ifelse(y < 0, "y is a negative number", "y is either positive or zero")
出力
[1] "y is a negative number"ヒント:any() と
all()
any() 関数は、ベクトルの中に少なくとも1つ
TRUE の値がある場合、 TRUE を返し、
そうでない場合は、 FALSE を返します。 これは、
%in% 演算子でも同様に使えます。 関数 all()
は、その名前が示唆しているように、ベクトル内の全ての値が
TRUE である時のみ、 TRUE となります。
繰り返し行う処理
If you want to iterate over a set of values, when the order of
iteration is important, and perform the same operation on each, a
for() loop will do the job. We saw for() loops
in the shell
lessons earlier. This is the most flexible of looping operations,
but therefore also the hardest to use correctly. In general, the advice
of many R users would be to learn about for()
loops, but to avoid using for() loops unless the order of
iteration is important: i.e. the calculation at each iteration depends
on the results of previous iterations. If the order of iteration is not
important, then you should learn about vectorized alternatives, such as
the purrr package, as they pay off in computational
efficiency.
for() ループの基本構造は:
例えば:
R
for (i in 1:10) {
  print(i)
}
出力
[1] 1
[1] 2
[1] 3
[1] 4
[1] 5
[1] 6
[1] 7
[1] 8
[1] 9
[1] 10
1:10 の部分は、ベクトルをその場で作るものです。
他のベクトルの中身を繰り返すこともできます。
for() ループを、もうひとつの for()
ループと入れ子となる形にすれば、 2つ同時に繰り返すこともできます。
R
for (i in 1:5) {
  for (j in c('a', 'b', 'c', 'd', 'e')) {
    print(paste(i,j))
  }
}
出力
[1] "1 a"
[1] "1 b"
[1] "1 c"
[1] "1 d"
[1] "1 e"
[1] "2 a"
[1] "2 b"
[1] "2 c"
[1] "2 d"
[1] "2 e"
[1] "3 a"
[1] "3 b"
[1] "3 c"
[1] "3 d"
[1] "3 e"
[1] "4 a"
[1] "4 b"
[1] "4 c"
[1] "4 d"
[1] "4 e"
[1] "5 a"
[1] "5 b"
[1] "5 c"
[1] "5 d"
[1] "5 e"
We notice in the output that when the first index (i) is
set to 1, the second index (j) iterates through its full
set of indices. Once the indices of j have been iterated
through, then i is incremented. This process continues
until the last index has been used for each for() loop.
結果を表示させずに、ループの結果を新しいオブジェクトに書き込むこともできます。
R
output_vector <- c()
for (i in 1:5) {
  for (j in c('a', 'b', 'c', 'd', 'e')) {
    temp_output <- paste(i, j)
    output_vector <- c(output_vector, temp_output)
  }
}
output_vector
出力
 [1] "1 a" "1 b" "1 c" "1 d" "1 e" "2 a" "2 b" "2 c" "2 d" "2 e" "3 a" "3 b"
[13] "3 c" "3 d" "3 e" "4 a" "4 b" "4 c" "4 d" "4 e" "5 a" "5 b" "5 c" "5 d"
[25] "5 e"
このアプローチが役に立つこともありますが、‘結果を太らせる’ (結果のオブジェクトを 徐々に積み上げる)と、演算する上で非効率になります。 ゆえに、多くの値の間を繰り返すときは避けましょう。
ヒント:結果を太らせないようにしましょう
One of the biggest things that trips up novices and experienced R users alike, is building a results object (vector, list, matrix, data frame) as your for loop progresses. Computers are very bad at handling this, so your calculations can very quickly slow to a crawl. It’s much better to define an empty results object before hand of appropriate dimensions, rather than initializing an empty object without dimensions. So if you know the end result will be stored in a matrix like above, create an empty matrix with 5 row and 5 columns, then at each iteration store the results in the appropriate location.
よりよい方法は、(空の)出力オブジェクトを、値を埋める前に宣言することです。 この例では、より複雑に見えますが、より効率的です。
R
output_matrix <- matrix(nrow = 5, ncol = 5)
j_vector <- c('a', 'b', 'c', 'd', 'e')
for (i in 1:5) {
  for (j in 1:5) {
    temp_j_value <- j_vector[j]
    temp_output <- paste(i, temp_j_value)
    output_matrix[i, j] <- temp_output
  }
}
output_vector2 <- as.vector(output_matrix)
output_vector2
出力
 [1] "1 a" "2 a" "3 a" "4 a" "5 a" "1 b" "2 b" "3 b" "4 b" "5 b" "1 c" "2 c"
[13] "3 c" "4 c" "5 c" "1 d" "2 d" "3 d" "4 d" "5 d" "1 e" "2 e" "3 e" "4 e"
[25] "5 e"ヒント:while ループ
時には、ある条件が満たされるまで繰り返す必要があります。 これは、
while() ループを使えばできます。
R will interpret a condition being met as “TRUE”.
while(this condition is true) \~\~\~ 例として、このwhileループは 一様分布(`runif()` 関数)から0.1よりも小さい数を得るまで、 0から1の間で乱数を生成します。
R
z <- 1
while(z > 0.1){
  z <- runif(1)
  cat(z, "\n")
}
while() loops will not always be appropriate. You have
to be particularly careful that you don’t end up stuck in an infinite
loop because your condition is always met and hence the while statement
never terminates.
チャレンジ2
Compare the objects output_vector and
output_vector2. Are they the same? If not, why not? How
would you change the last block of code to make
output_vector2 the same as output_vector?
We can check whether the two vectors are identical using the
all() function:
R
all(output_vector == output_vector2)
However, all the elements of output_vector can be found
in output_vector2:
R
all(output_vector %in% output_vector2)
and vice versa:
R
all(output_vector2 %in% output_vector)
therefore, the element in output_vector and
output_vector2 are just sorted in a different order. This
is because as.vector() outputs the elements of an input
matrix going over its column. Taking a look at
output_matrix, we can notice that we want its elements by
rows. The solution is to transpose the output_matrix. We
can do it either by calling the transpose function t() or
by inputting the elements in the right order. The first solution
requires to change the original
R
output_vector2 <- as.vector(output_matrix)
into
R
output_vector2 <- as.vector(t(output_matrix))
The second solution requires to change
R
output_matrix[i, j] <- temp_output
into
R
output_matrix[j, i] <- temp_output
チャレンジ3
gapminder
データを大陸ごとにループし、平均余命が50歳以上かどうかを表示する
スクリプトを書きましょう。
Step 1: We want to make sure we can extract all the unique values of the continent vector
R
gapminder <- read.csv("data/gapminder_data.csv")
unique(gapminder$continent)
Step 2: We also need to loop over each of these
continents and calculate the average life expectancy for each
subset of
data.gapminder <- read.csv("data/gapminder\_data.csv") unique(gapminder$continent) \~\~\~ {: .language-r} 手順2 :これらの大陸のそれぞれにループをし、その `部分集合` データごとに平均余命を出す必要があります。
- それは次のようにすればできます: 1.
- ‘大陸(continent)’ の固有の値のそれぞれについてループする 2.
- Return the calculated life expectancy to the user by printing the output:
R
for (iContinent in unique(gapminder$continent)) {
  tmp <- gapminder[gapminder$continent == iContinent, ]
  cat(iContinent, mean(tmp$lifeExp, na.rm = TRUE), "\n")
  rm(tmp)
}
Step 3: The exercise only wants the output printed
if the average life expectancy is less than 50 or greater than 50.
ゆえに、結果を表示させる前に if
条件をつけて、演算された平均余命が基準値以上か、基準値未満かを判別し、結果によって正しい出力を表示させる必要があります。
これを踏まえて、上の (3) を修正する必要があります: 3a.
3a. If the calculated life expectancy is less than some threshold (50 years), return the continent and a statement that life expectancy is less than threshold, otherwise return the continent and a statement that life expectancy is greater than threshold:
R
thresholdValue <- 50

for (iContinent in unique(gapminder$continent)) {
   tmp <- mean(gapminder[gapminder$continent == iContinent, "lifeExp"])

   if (tmp < thresholdValue){
       cat("Average Life Expectancy in", iContinent, "is less than", thresholdValue, "\n")
   } else {
       cat("Average Life Expectancy in", iContinent, "is greater than", thresholdValue, "\n")
   } # end if else condition
   rm(tmp)
} # end for loop
チャレンジ4
チャレンジ3のスクリプトをそれぞれの国ごとにループする形に直してください。 今回は、平均余命は50歳未満か、50歳以上70歳未満か、70歳以上かを 表示しましょう。
We modify our solution to Challenge 3 by now adding two thresholds,
lowerThreshold and upperThreshold and
extending our if-else statements:
R
チャレンジ4の解答 チャレンジ3の解答を、 `lowerThreshold` と `upperThreshold` の2つの基準値を加え、if-else 宣言を拡張する形で修正します: ~~~ lowerThreshold <- 50 upperThreshold <- 70 for( iCountry in unique(gapminder$country) ){ tmp <- mean(subset(gapminder, country==iCountry)$lifeExp) if(tmp < lowerThreshold){ cat("Average Life Expectancy in", iCountry, "is less than", lowerThreshold, "\\n") } else if(tmp lowerThreshold && tmp < upperThreshold){ cat("Average Life Expectancy in", iCountry, "is between", lowerThreshold, "and", upperThreshold, "\\n") } else{ cat("Average Life Expectancy in", iCountry, "is greater than", upperThreshold, "\\n") } rm(tmp) } ~~~ {: .language-r}チャレンジ5 - 上級
Write a script that loops over each country in the
gapminder dataset, tests whether the country starts with a
‘B’, and graphs life expectancy against time as a line graph if the mean
life expectancy is under 50 years.
We will use the grep() command that was introduced in
the Unix
Shell lesson to find countries that start with “B.” Lets understand
how to do this first. Following from the Unix shell section we may be
tempted to try the following
R
grep("^B", unique(gapminder$country))
But when we evaluate this command it returns the indices of the
factor variable country that start with “B.” To get the
values, we must add the value=TRUE option to the
grep() command:
R
grep("^B", unique(gapminder$country), value = TRUE)
We will now store these countries in a variable called
candidateCountries, and then loop over each entry in the variable.
Inside the loop, we evaluate the average life expectancy for each
country, and if the average life expectancy is less than 50 we use
base-plot to plot the evolution of average life expectancy using
with() and subset():
R
thresholdValue <- 50
candidateCountries <- grep("^B", unique(gapminder$country), value = TRUE)

for (iCountry in candidateCountries) {
    tmp <- mean(gapminder[gapminder$country == iCountry, "lifeExp"])

    if (tmp < thresholdValue) {
        cat("Average Life Expectancy in", iCountry, "is less than", thresholdValue, "plotting life expectancy graph... \n")

        with(subset(gapminder, country == iCountry),
                plot(year, lifeExp,
                     type = "o",
                     main = paste("Life Expectancy in", iCountry, "over time"),
                     ylab = "Life Expectancy",
                     xlab = "Year"
                     ) # end plot
             ) # end with
    } # end if
    rm(tmp)
} # end for loop
- Use
ifandelseto make choices. - Use
forto repeat operations.
Content from Creating Publication-Quality Graphics with ggplot2
最終更新日:2025-11-11 | ページの編集
概要
質問
- How can I create publication-quality graphics in R?
目的
- To be able to use ggplot2 to generate publication-quality graphics.
- To apply geometry, aesthetic, and statistics layers to a ggplot plot.
- To manipulate the aesthetics of a plot using different colors, shapes, and lines.
- To improve data visualization through transforming scales and paneling by group.
- To save a plot created with ggplot to disk.
データをプロットすることは、データとその変数間の様々な関係をクイックに探索する最良の方法の一つです。
Rには、主に3つのプロットシステムがあります。 R組み込みplot関数、 lattice パッケージ、ggplot2 パッケージです。
今回、私たちはggplot2パッケージについて学んでいきます。 なぜなら、ggplot2パッケージは出版品質並のグラフィック作成に最も効果的だからです。
ggplot2 is built on the grammar of graphics, the idea that any plot can be built from the same set of components: a data set, mapping aesthetics, and graphical layers:
Data sets are the data that you, the user, provide.
Mapping aesthetics are what connect the data to the graphics. They tell ggplot2 how to use your data to affect how the graph looks, such as changing what is plotted on the X or Y axis, or the size or color of different data points.
Layers are the actual graphical output from ggplot2. Layers determine what kinds of plot are shown (scatterplot, histogram, etc.), the coordinate system used (rectangular, polar, others), and other important aspects of the plot. このアイディアは、Photoshop、Illustrator、Inkscapeなどの画像編集ソフトを使用する場面でお馴染みかもしれません。
Let’s start off building an example using the gapminder data from
earlier. The most basic function is ggplot, which lets R
know that we’re creating a new plot. Any of the arguments we give the
ggplot function are the global options for the
plot: they apply to all layers on the plot.
R
library("ggplot2")
ggplot(data = gapminder)

Here we called ggplot and told it what data we want to
show on our figure. This is not enough information for
ggplot to actually draw anything. It only creates a blank
slate for other elements to be added to.
Now we’re going to add in the mapping aesthetics
using the aes function. aes tells
ggplot how variables in the data map to
aesthetic properties of the figure, such as which columns of
the data should be used for the x and
y locations.
R
ggplot(data = gapminder, mapping = aes(x = gdpPercap, y = lifeExp))
Here we told ggplot we want to plot the “gdpPercap”
column of the gapminder data frame on the x-axis, and the “lifeExp”
column on the y-axis. Notice that we didn’t need to explicitly pass
aes these columns
(e.g. x = gapminder[, "gdpPercap"]), this is because
ggplot is smart enough to know to look in the
data for that column!
The final part of making our plot is to tell ggplot how
we want to visually represent the data. We do this by adding a new
layer to the plot using one of the
geom functions.
R
ggplot(data = gapminder, mapping = aes(x = gdpPercap, y = lifeExp)) +
  geom_point()
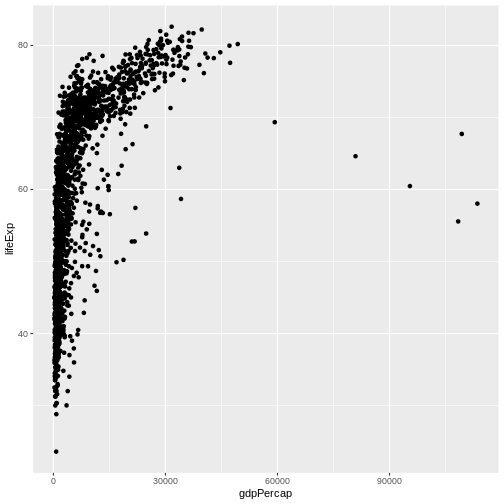
Here we used geom_point, which tells ggplot
we want to visually represent the relationship between
x and y as a scatterplot of
points.
チャレンジ1
Modify the example so that the figure shows how life expectancy has changed over time:
R
ggplot(data = gapminder, mapping = aes(x = gdpPercap, y = lifeExp)) + geom_point()
Hint: the gapminder dataset has a column called “year”, which should appear on the x-axis.
Here is one possible solution:
R
ggplot(data = gapminder, mapping = aes(x = year, y = lifeExp)) + geom_point()
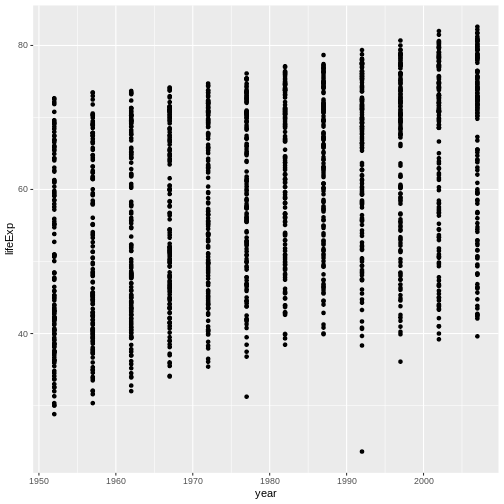
チャレンジ2
チャレンジ 2 先の例題とチャレンジでは、aes
関数を使用して、各点の x と y の位置について散布図 geom を指定しました。
修正できるもう1つのエステティック属性は、点の色です。
先のチャレンジのコードを修正して、“continent” 列で点に色付けして下さい。
データにどはどのような傾向が見られますか?
それらの傾向は、あなたが期待したものですか?
The solution presented below adds color=continent to the
call of the aes function. The general trend seems to
indicate an increased life expectancy over the years. On continents with
stronger economies we find a longer life expectancy.
R
ggplot(data = gapminder, mapping = aes(x = year, y = lifeExp, color=continent)) +
  geom_point()
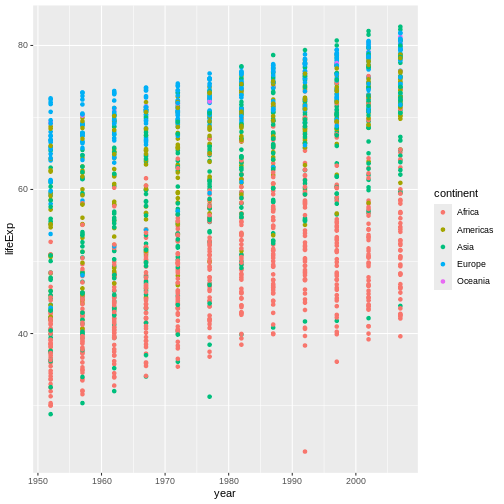
レイヤー
散布図を使用することは、時間経過による変化を視覚化するのに、おそらく最適ではありません。 代わりに、データを線グラフとして可視化するようggplotに指示しましょう。
R
ggplot(data = gapminder, mapping = aes(x=year, y=lifeExp, color=continent)) +
  geom_line()
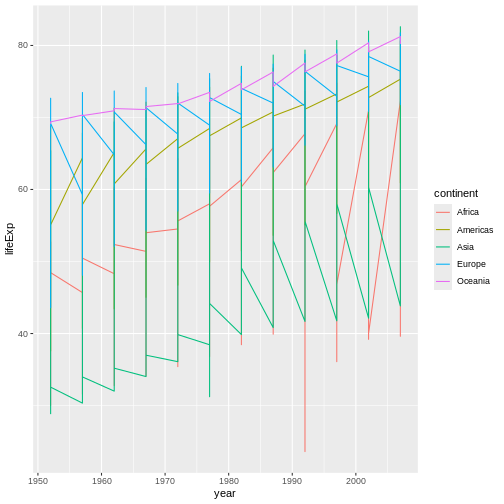
geom_pointレイヤーを追加する代わりに、geom_lineレイヤーを追加しました。
However, the result doesn’t look quite as we might have expected: it seems to be jumping around a lot in each continent. Let’s try to separate the data by country, plotting one line for each country:
R
ggplot(data = gapminder, mapping = aes(x=year, y=lifeExp, group=country, color=continent)) +
  geom_line()
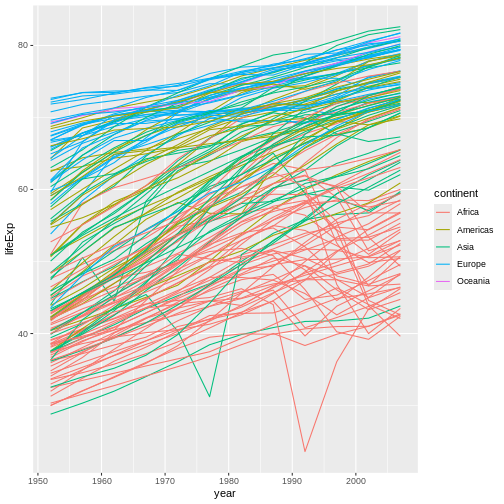
by
エステティックを追加し、各国ごとに線を描くようggplotに指示します。
しかし、線と点の両方をプロット上に視覚化したい場合はどうすればよいでしょうか? プロットに別のレイヤーを追加するだけです。
R
ggplot(data = gapminder, mapping = aes(x=year, y=lifeExp, group=country, color=continent)) +
  geom_line() + geom_point()
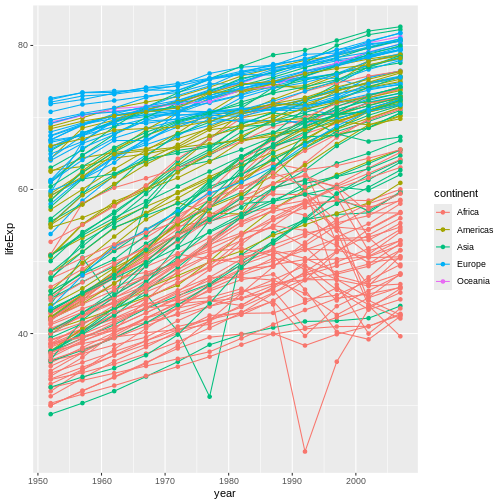
It’s important to note that each layer is drawn on top of the previous layer. In this example, the points have been drawn on top of the lines. Here’s a demonstration:
R
ggplot(data = gapminder, mapping = aes(x=year, y=lifeExp, group=country)) +
  geom_line(mapping = aes(color=continent)) + geom_point()
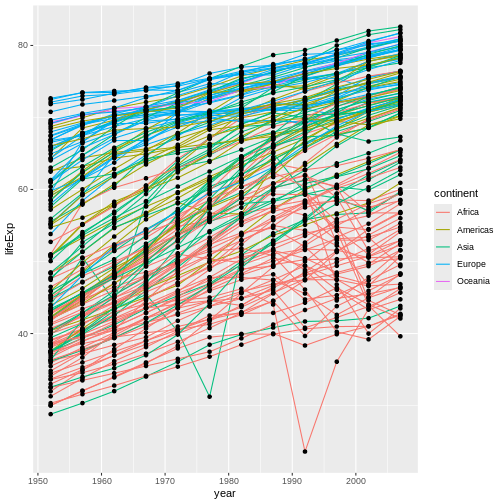
この例では、 color
エステティックマッピングが、ggplotのグローバルプロットオプションからgeom_lineレイヤーに移動されたため、
点には色が適用されなくなりました。
これで、点が線の上に描画されていることがわかります。
ヒント:エステティック属性に、マッピングの代わりに値を設定する
So far, we’ve seen how to use an aesthetic (such as
color) as a mapping to a variable in the data.
For example, when we use
geom_line(mapping = aes(color=continent)), ggplot will give
a different color to each continent. But what if we want to change the
color of all lines to blue? You may think that
geom_line(mapping = aes(color="blue")) should work, but it
doesn’t. Since we don’t want to create a mapping to a specific variable,
we can move the color specification outside of the aes()
function, like this: geom_line(color="blue").
チャレンジ3
Switch the order of the point and line layers from the previous example. 何が起こったのでしょう?Rは、csvファイルを読み込む際、 列にある全てのものが同じ基本の型であるべきだと主張します。もし、列の 全て が、 double型であることが確認できない場合、その列の だれも double型にならないのです。
The lines now get drawn over the points!
R
ggplot(data = gapminder, mapping = aes(x=year, y=lifeExp, group=country)) +
 geom_point() + geom_line(mapping = aes(color=continent))
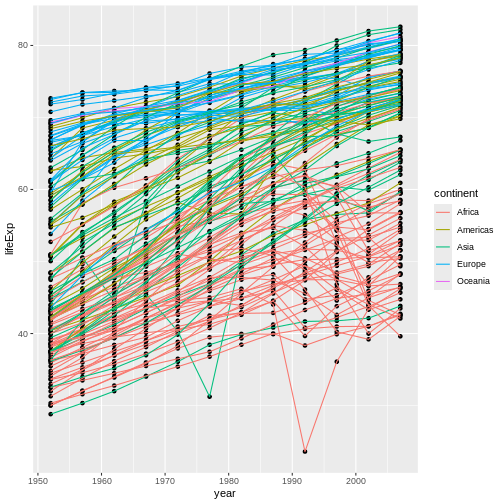
変換と統計
ggplot2を使用すると、統計モデルをデータに適用することが容易になります。 デモのために、最初の例に戻ります。
R
ggplot(data = gapminder, mapping = aes(x = gdpPercap, y = lifeExp)) +
  geom_point()
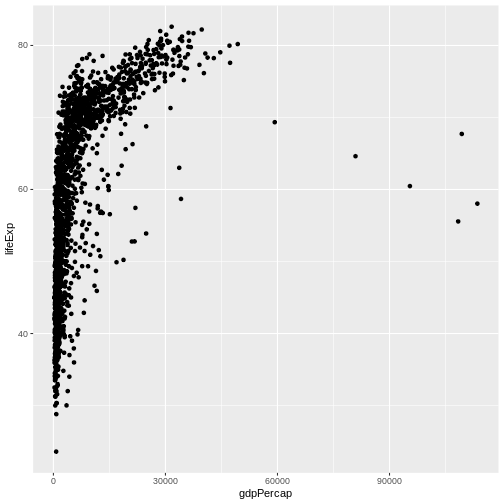
Currently it’s hard to see the relationship between the points due to some strong outliers in GDP per capita. We can change the scale of units on the x axis using the scale functions. These control the mapping between the data values and visual values of an aesthetic. We can also modify the transparency of the points, using the alpha function, which is especially helpful when you have a large amount of data which is very clustered.
R
ggplot(data = gapminder, mapping = aes(x = gdpPercap, y = lifeExp)) +
  geom_point(alpha = 0.5) + scale_x_log10()
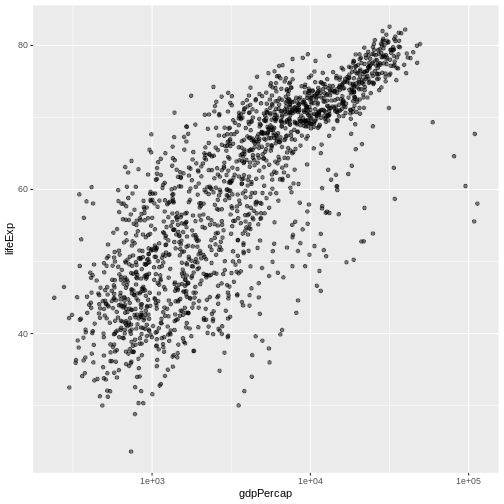
The scale_x_log10 function applied a transformation to
the coordinate system of the plot, so that each multiple of 10 is evenly
spaced from left to right. For example, a GDP per capita of 1,000 is the
same horizontal distance away from a value of 10,000 as the 10,000 value
is from 100,000. This helps to visualize the spread of the data along
the x-axis.
ヒントのリマインダ:エステティック属性に、マッピングの代わりに値を設定する
geom_point(alpha = 0.5)を使用したことに注目してください。
先のヒントで触れたように、aes()関数以外の設定を使用すると、この値がすべての点で使用されます。
この場合、この値が必要です。しかし、他のエステティック設定と同様に、
alpha はデータ内の変数にマッピングすることもできます。
たとえば、geom_point(aes(alpha = continent))を使用して、各大陸に異なる透明度を与えることができます。
geom_smoothという別のレイヤーを追加することで、データに単純な関係を当てはめることができます。
R
ggplot(data = gapminder, mapping = aes(x = gdpPercap, y = lifeExp)) +
  geom_point(alpha = 0.5) + scale_x_log10() + geom_smooth(method="lm")
出力
`geom_smooth()` using formula = 'y ~ x'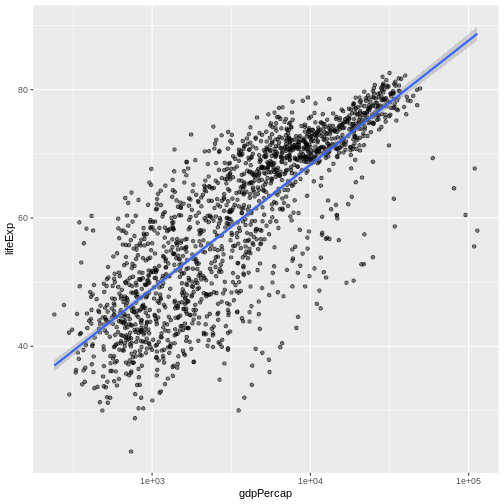
geom_smoothレイヤーで size
エステティック属性を設定することによって、
線を太くすることができます。
R
ggplot(data = gapminder, mapping = aes(x = gdpPercap, y = lifeExp)) +
  geom_point(alpha = 0.5) + scale_x_log10() + geom_smooth(method="lm", linewidth=1.5)
出力
`geom_smooth()` using formula = 'y ~ x'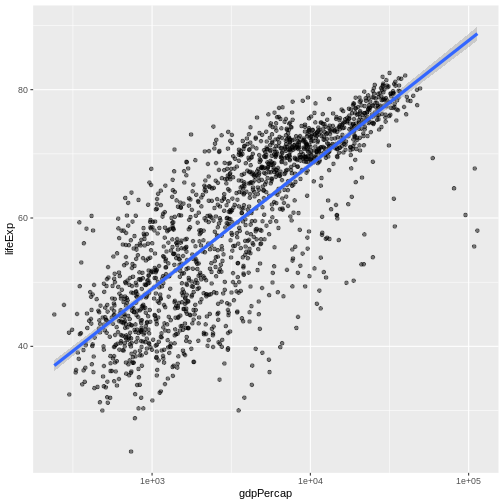
エステティック属性を指定する方法は2つあります。 Here we set
the linewidth aesthetic by passing it as an argument to
geom_smooth and it is applied the same to the whole
geom.
これまでのレッスンでは、データの変数とその視覚表現の間のマッピングを定義するためにaes関数を使用しました。
チャレンジ 4a
前の例を用いて、点レイヤー上の点の色とサイズを変更して下さい。
ヒント:’aes’関数を使用しないでください。
Hint: the equivalent of linewidth for points is
size.
Here a possible solution: Notice that the color argument
is supplied outside of the aes() function. This means that
it applies to all data points on the graph and is not related to a
specific variable.
R
ggplot(data = gapminder, mapping = aes(x = gdpPercap, y = lifeExp)) +
 geom_point(size=3, color="orange") + scale_x_log10() +
 geom_smooth(method="lm", linewidth=1.5)
出力
`geom_smooth()` using formula = 'y ~ x'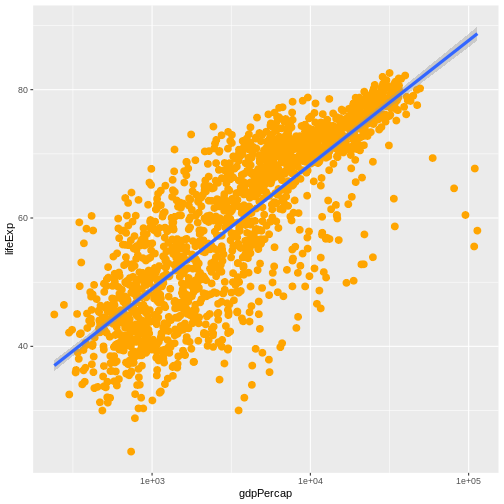
チャレンジ 4b
点を異なる形にし、また大陸毎に色分けと傾向線の描画をするために、 チャレンジ4aの回答を変更して下さい。 ヒント:color引数は、aes関数内で使用することができます。
Here is a possible solution: Notice that supplying the
color argument inside the aes() functions
enables you to connect it to a certain variable. The shape
argument, as you can see, modifies all data points the same way (it is
outside the aes() call) while the color
argument which is placed inside the aes() call modifies a
point’s color based on its continent value.
R
ggplot(data = gapminder, mapping = aes(x = gdpPercap, y = lifeExp, color = continent)) +
 geom_point(size=3, shape=17) + scale_x_log10() +
 geom_smooth(method="lm", linewidth=1.5)
出力
`geom_smooth()` using formula = 'y ~ x'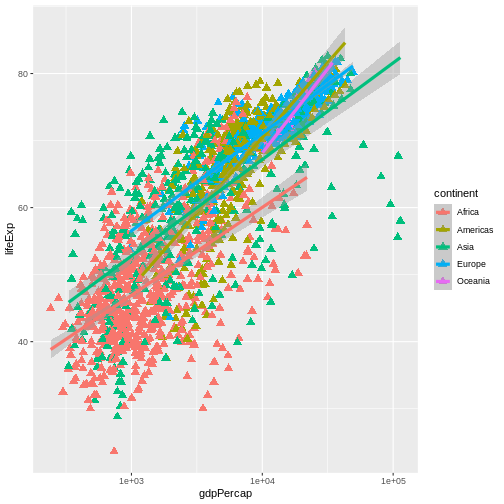
複数パネルの図
先の例では、すべての国の平均余命の変化を1つのプロットで視覚化しました。 一方、 facet パネルのレイヤーを追加することで、複数のパネルに分割することができます。
ヒント
We start by making a subset of data including only countries located in the Americas. This includes 25 countries, which will begin to clutter the figure. Note that we apply a “theme” definition to rotate the x-axis labels to maintain readability. Nearly everything in ggplot2 is customizable.
R
americas <- gapminder[gapminder$continent == "Americas",]
ggplot(data = americas, mapping = aes(x = year, y = lifeExp)) +
  geom_line() +
  facet_wrap( ~ country) +
  theme(axis.text.x = element_text(angle = 45))
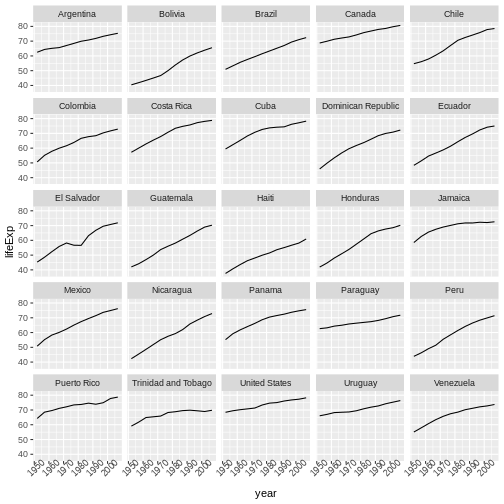
facet_wrapレイヤーは引数として“formula”をとり、チルダ(~)で表記されます。
これは、gapminderデータセットのcountry列にある各々の一意な値のパネルを描画するようRに指示します。
テキストの変更
分析結果の発表に向けてこの図を整理するにあたり、いくつかのテキスト要素を変更する必要があります。 x軸はあまりにも雑然としており、y軸はデータフレームの列名ではなく、“Life expectancy”と読み替えるべきです。
これを行うには、いくつかのレイヤーを追加する必要があります。 theme
レイヤーは、軸テキストと全体のテキストサイズを制御します。
軸、プロットタイトル、および任意の凡例のラベルは、labs関数を使用して設定できます。
凡例のタイトルは、aes関数で使用したものと同じ名前を設定します。
したがって、color凡例のタイトルはcolor = "Continent"を用いて設定され、
fill凡例のタイトルはfill = "任意のタイトル"を使用して設定されます。
R
ggplot(data = americas, mapping = aes(x = year, y = lifeExp, color=continent)) +
  geom_line() + facet_wrap( ~ country) +
  labs(
    x = "Year",              # x axis title
    y = "Life expectancy",   # y axis title
    title = "Figure 1",      # main title of figure
    color = "Continent"      # title of legend
  ) +
  theme(axis.text.x = element_text(angle = 90, hjust = 1))
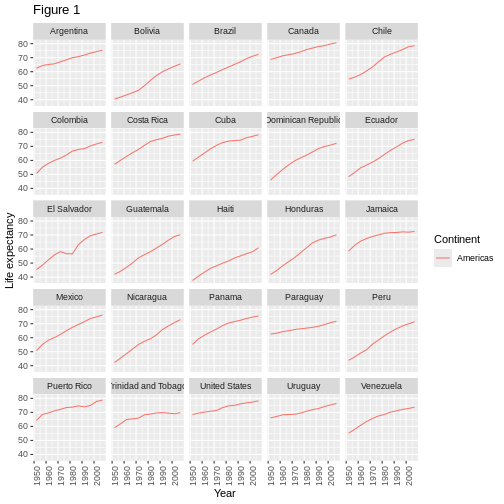
プロットのエクスポート
ggsave()関数を使用すると、ggplotで作成したプロットをエクスポートすることができます。
出版、公開のための高品質グラフィックを作成するために、
適切な引数(width、height、およびdpi)を調整してプロットの寸法と解像度を指定できます。
上記のように、そのプロットを保存するには、最初にそのプロットを変数lifeExp_plotに割り当て、
ggsaveにそのプロットをpng形式でresultsというディレクトリに保存するよう指示します。
(作業ディレクトリに’results
/’フォルダがあることを確認してください。)
R
lifeExp_plot <- ggplot(data = americas, mapping = aes(x = year, y = lifeExp, color=continent)) +
  geom_line() + facet_wrap( ~ country) +
  labs(
    x = "Year",              # x axis title
    y = "Life expectancy",   # y axis title
    title = "Figure 1",      # main title of figure
    color = "Continent"      # title of legend
  ) +
  theme(axis.text.x = element_text(angle = 90, hjust = 1))

ggsave(filename = "results/lifeExp.png", plot = lifeExp_plot, width = 12, height = 10, dpi = 300, units = "cm")
ggsaveには素晴らしい点が二つあります。
一つ目は、最後のプロットがデフォルトになるので、plot引数を省略すると、ggplotで作成した最後のプロットが自動的に保存されることです。
二つ目は、ファイル名に指定したファイル拡張子(例:.pngまたは.pdf)からプロットを保存するフォーマットを決定しようとします。
必要な場合は、device引数に明示的にフォーマットを指定できます。
This is a taste of what you can do with ggplot2. RStudio provides a really useful cheat sheet of the different layers available, and more extensive documentation is available on the ggplot2 website. All RStudio cheat sheets are available from the RStudio website. Finally, if you have no idea how to change something, a quick Google search will usually send you to a relevant question and answer on Stack Overflow with reusable code to modify!
チャレンジ5
Generate boxplots to compare life expectancy between the different continents during the available years.
Advanced:
- Rename y axis as Life Expectancy.
- Remove x axis labels.
Here a possible solution: xlab() and ylab()
set labels for the x and y axes, respectively The axis title, text and
ticks are attributes of the theme and must be modified within a
theme() call.
R
ggplot(data = gapminder, mapping = aes(x = continent, y = lifeExp, fill = continent)) +
 geom_boxplot() + facet_wrap(~year) +
 ylab("Life Expectancy") +
 theme(axis.title.x=element_blank(),
       axis.text.x = element_blank(),
       axis.ticks.x = element_blank())
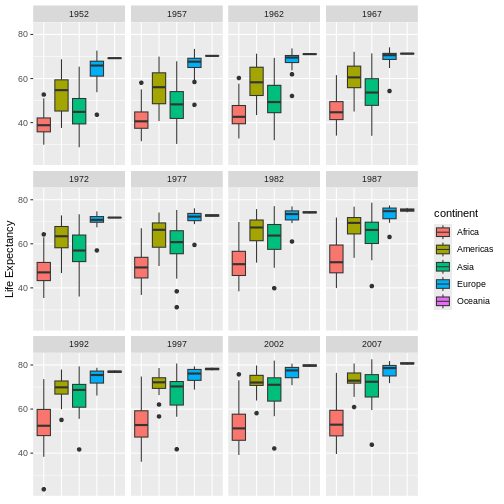
- Use
ggplot2to create plots. - Think about graphics in layers: aesthetics, geometry, statistics, scale transformation, and grouping.
Content from ベクトル化
最終更新日:2025-11-11 | ページの編集
概要
質問
- How can I operate on all the elements of a vector at once?
目的
- To understand vectorized operations in R.
Rの関数はほとんどがベクトル化されており、関数はベクトルの全ての要素を最初から操作してくれるので、ベクトルの要素ごとにいちいちループする必要がありません。 おかげで簡潔で読み易く、エラーの少ないコードを書くことができます。
R
x <- 1:4
x * 2
出力
[1] 2 4 6 8積はベクトルの要素ごとに実行されました。
2つのベクトルを足し合わせることもできます:
R
y <- 6:9
x + y
出力
[1] 7 9 11 13この場合 x の各要素が対応する
yの要素に足されます。
Here is how we would add two vectors together using a for loop:
R
output_vector <- c()
for (i in 1:4) {
output_vector[i] <- x[i] + y[i]
}
output_vector
出力
[1] 7 9 11 13Compare this to the output using vectorised operations.
R
sum_xy <- x + y
sum_xy
出力
[1] 7 9 11 13チャレンジ1
gapminder データセットの pop
列でこれに挑戦してみましょう。
gapminder
データフレームに百万人単位の人口を示す列を追加しましょう。
データフレームの先頭か最後を確認して、追加に成功したか確認しましょう。
gapminder データセットの pop
列でこれに挑戦してみましょう。
gapminder
データフレームに百万人単位の人口を示す列を追加しましょう。
データフレームの先頭か最後を確認して、追加に成功したか確認しましょう。
R
gapminder$pop_millions <- gapminder$pop / 1e6
head(gapminder)
出力
country year pop continent lifeExp gdpPercap pop_millions
1 Afghanistan 1952 8425333 Asia 28.801 779.4453 8.425333
2 Afghanistan 1957 9240934 Asia 30.332 820.8530 9.240934
3 Afghanistan 1962 10267083 Asia 31.997 853.1007 10.267083
4 Afghanistan 1967 11537966 Asia 34.020 836.1971 11.537966
5 Afghanistan 1972 13079460 Asia 36.088 739.9811 13.079460
6 Afghanistan 1977 14880372 Asia 38.438 786.1134 14.880372チャレンジ2
一つの図に、100万人単位の人口を年ごとにプロットしてみましょう。 国ごとの区別はつかなくていいです。
練習を繰り返して、中国とインドとインドネシアだけを含む図を 作ってみましょう。 先程と同じく、国ごとの区別はつかなくていいです。
チャレンジの解答 100万人単位の人口を年ごとにプロットして、作図方法を復習しましょう。
R
ggplot(gapminder, aes(x = year, y = pop_millions)) +
geom_point()
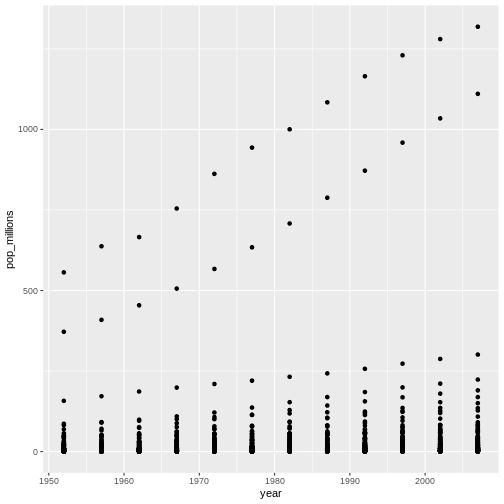
R
countryset <- c("China","India","Indonesia")
ggplot(gapminder[gapminder$country %in% countryset,],
aes(x = year, y = pop_millions)) +
geom_point()
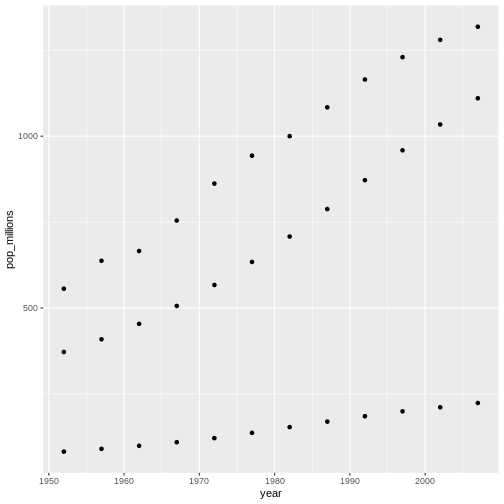
比較演算子や論理演算子に加え、多くの関数もベクトル化されています。
比較演算子
R
x > 2
出力
[1] FALSE FALSE TRUE TRUE論理演算子
エラー
Error in parse(text = input): <text>:1:8: unexpected numeric constant
1: a <- x 3
^Tip: 論理ベクトルに使える便利な関数
-
any()はベクトルの要素の中に一つでもTRUEがあればTRUEを返します。 -
all()はベクトルの要素が 全てTRUEであればTRUEを返します。
ほとんどの関数はベクトルを要素ごとに処理します。
関数
R
x <- 1:4
log(x)
出力
[1] 0.0000000 0.6931472 1.0986123 1.3862944ベクトル化された操作は行列を要素ごとに処理します:
R
m <- matrix(1:12, nrow=3, ncol=4)
m * -1
出力
[,1] [,2] [,3] [,4]
[1,] -1 -4 -7 -10
[2,] -2 -5 -8 -11
[3,] -3 -6 -9 -12Tip: 要素ごとの積 vs. 行列の積
非常に重要: 演算子は要素ごとの積を行います! To do
matrix multiplication, we need to use the %*% operator:
R
m %*% matrix(1, nrow=4, ncol=1)
出力
[,1]
[1,] 22
[2,] 26
[3,] 30R
matrix(1:4, nrow=1) %*% matrix(1:4, ncol=1)
出力
[,1]
[1,] 30更に行列代数について知るには Quick-R reference guide を参照して下さい
チャレンジ3
以下のリストがあるとします:
R
m <- matrix(1:12, nrow=3, ncol=4)
m
出力
[,1] [,2] [,3] [,4]
[1,] 1 4 7 10
[2,] 2 5 8 11
[3,] 3 6 9 12Write down what you think will happen when you run:
m ^ -1m * c(1, 0, -1)m > c(0, 20)m * c(1, 0, -1, 2)
Did you get the output you expected? If not, ask a helper!
以下のリストがあるとします:
R
m <- matrix(1:12, nrow=3, ncol=4)
m
出力
[,1] [,2] [,3] [,4]
[1,] 1 4 7 10
[2,] 2 5 8 11
[3,] 3 6 9 12Write down what you think will happen when you run:
m ^ -1
出力
[,1] [,2] [,3] [,4]
[1,] 1.0000000 0.2500000 0.1428571 0.10000000
[2,] 0.5000000 0.2000000 0.1250000 0.09090909
[3,] 0.3333333 0.1666667 0.1111111 0.08333333m * c(1, 0, -1)
出力
[,1] [,2] [,3] [,4]
[1,] 1 4 7 10
[2,] 0 0 0 0
[3,] -3 -6 -9 -12m > c(0, 20)
出力
[,1] [,2] [,3] [,4]
[1,] TRUE FALSE TRUE FALSE
[2,] FALSE TRUE FALSE TRUE
[3,] TRUE FALSE TRUE FALSEチャレンジ4
以下の分数の数列の総和が知りたいとします: ~~~ x:
R
x = 1/(1^2) + 1/(2^2) + 1/(3^2) + ... + 1/(n^2)
- /(n^) ~~~ これをタイプするのは面倒な上に、nが大きいと不可能です。 ベクトル化を用いて n = 100 の場合を計算しましょう。 n = 10,000 の時の総和はいくつでしょうか?
以下の分数の数列の総和が知りたいとします: ~~~ x:
R
x = 1/(1^2) + 1/(2^2) + 1/(3^2) + ... + 1/(n^2)
- /(n^) ~~~ これをタイプするのは面倒な上に、nが大きいと不可能です。 ベクトル化を用いて n = 100 の場合を計算しましょう。 n = 10,000 の時の総和はいくつでしょうか?
R
sum(1/(1:100)^2)
出力
[1] 1.634984R
sum(1/(1:1e04)^2)
出力
[1] 1.644834R
n <- 10000
sum(1/(1:n)^2)
出力
[1] 1.644834We can also obtain the same results using a function:
R
inverse_sum_of_squares <- function(n) {
sum(1/(1:n)^2)
}
inverse_sum_of_squares(100)
出力
[1] 1.634984R
inverse_sum_of_squares(10000)
出力
[1] 1.644834R
n <- 10000
inverse_sum_of_squares(n)
出力
[1] 1.644834Tip: Operations on vectors of unequal length
Operations can also be performed on vectors of unequal length, through a process known as recycling. This process automatically repeats the smaller vector until it matches the length of the larger vector. R will provide a warning if the larger vector is not a multiple of the smaller vector.
R
x <- c(1, 2, 3)
y <- c(1, 2, 3, 4, 5, 6, 7)
x + y
警告
Warning in x + y: longer object length is not a multiple of shorter object
length出力
[1] 2 4 6 5 7 9 8Vector x was recycled to match the length of vector
y
- Use vectorized operations instead of loops.
Content from Functions Explained
最終更新日:2025-11-11 | ページの編集
概要
質問
- How can I write a new function in R?
目的
- Define a function that takes arguments.
- Return a value from a function.
- Check argument conditions with
stopifnot()in functions. - Test a function.
- Set default values for function arguments.
- Explain why we should divide programs into small, single-purpose functions.
分析したいデータセットが一つだけなら、ファイルを表計算ソフトで読み込み、単純な統計値をプロットした方が早いでしょう。 しかし、gapmider データは定期的に更新されるので、後から新しい情報を読み込み分析し直したくなります。 また、将来的には似たようなデータを違う場所から入手することもあるでしょう。
この講義では関数の書き方を学ぶことで、同じ操作を一つのコマンドで繰り返せるようになります。
関数とは何でしょう?
関数は連続した操作を一つに纏め、後から使うときのために保存しておきます。 Functions provide:
- a name we can remember and invoke it by
- relief from the need to remember the individual operations
- a defined set of inputs and expected outputs
- rich connections to the larger programming environment
As the basic building block of most programming languages, user-defined functions constitute “programming” as much as any single abstraction can. 関数を書いた時点であなたはコンピュータープログラマーです。
関数を定義しましょう。
functions/ ディレクトリ内に新しく functions-lesson.R
と名付けた R スクリプトを作成して開きましょう。
The general structure of a function is:
R
my_function <- function(parameters) {
# perform action
# return value
}
華氏をケルビンに変換する fahr_to_kelvin()
という関数を定義しましょう。
R
fahr_to_kelvin <- function(temp) {
kelvin <- ((temp - 32) * (5 / 9)) + 273.15
return(kelvin)
}
fahr_to_kelvin()
を定義するには、fahr_to_kelvin に function
の出力を指定します。 引数の名前の一覧は括弧に中に書きます。 次に関数の本文 (body) として
走らせた時の実行内容を波括弧 ({}) の中に記述します。
本文はスペース二つでインデントしておきます。
これによりコードの操作内容を変更せずに可読性を向上させます。
It is useful to think of creating functions like writing a cookbook. First you define the “ingredients” that your function needs. In this case, we only need one ingredient to use our function: “temp”. After we list our ingredients, we then say what we will do with them, in this case, we are taking our ingredient and applying a set of mathematical operators to it.
関数を呼び出す時、引数に指定した値は関数内で用いられる変数に与えられます。 関数の中では関数を呼び出した相手に結果を送るために return 文 を用います。
ヒント
return 文が不要なことは R の変わった特徴の一つです。 R では関数の本文の最終行に記述された変数が自動的に返り値になります。 しかし、わかりやすくするために return 文を明示的に記述します。
関数を実行してみましょう。 自分の関数を呼び出す方法は他の関数を呼び出す方法と同じです。
R
# 水の凝固点 fahr_to_kelvin(32)
R
# 水の沸点 fahr_to_kelvin(212)
チャレンジ1
Write a function called kelvin_to_celsius() that takes a
temperature in Kelvin and returns that temperature in Celsius.
Hint: To convert from Kelvin to Celsius you subtract 273.15
Write a function called kelvin_to_celsius that takes a
temperature in Kelvin and returns that temperature in Celsius
R
kelvin_to_celsius <- function(temp) {
celsius <- temp - 273.15
return(celsius)
}
関数を組み合わせましょう
関数の真髄を発揮するのは、関数を混ぜ合わせ組み合わせてより多きな塊にすることで、望み通りの効果を得る時です。
華氏をケルビンに変換する関数とケルビンをセ氏に変換する関数の2つを定義しましょう。
R
fahr_to_kelvin <- function(temp) {
kelvin <- ((temp - 32) * (5 / 9)) + 273.15
return(kelvin)
}
kelvin_to_celsius <- function(temp) {
celsius <- temp - 273.15
return(celsius)
}
チャレンジ2
Define the function to convert directly from Fahrenheit to Celsius, by reusing the two functions above (or using your own functions if you prefer).
Define the function to convert directly from Fahrenheit to Celsius, by reusing these two functions above
R
fahr_to_celsius <- function(temp) {
temp_k <- fahr_to_kelvin(temp)
result <- kelvin_to_celsius(temp_k)
return(result)
}
幕間: 防衛的プログラミング
関数を書くことで R
のコードを効率的に再利用したりモジュール化する方法を理解し始めたところですが、
関数は想定した用途でのみ機能するように確実に設計することが重要です。
関数の引数を検査することは 防衛的プログラミング の考え方に繋がります。
防衛的プログラミングでは状況を頻繁に検査し何かおかしなことがあればエラーを返すことを推奨します。
このような検査は、プログラム実行を継続する前に現状が TRUE
であることをアサート(表明・断言)するので、アサーション文と呼ばれます。
アサーション文により、エラーがどこで起きているか分かりやすくなりデバッグが容易になります。
stopifnot() を用いて状態を検査しましょう
華氏をケルビンに変換する fahr_to_kelvin()
関数について再検討してみましょう。 この関数の定義は以下の通りです。
R
fahr_to_kelvin <- function(temp) {
kelvin <- ((temp - 32) * (5 / 9)) + 273.15
return(kelvin)
}
For this function to work as intended, the argument temp
must be a numeric value; otherwise, the mathematical
procedure for converting between the two temperature scales will not
work. To create an error, we can use the function stop().
For example, since the argument temp must be a
numeric vector, we could check for this condition with an
if statement and throw an error if the condition was
violated. We could augment our function above like so:
R
fahr_to_kelvin <- function(temp) {
if (!is.numeric(temp)) {
stop("temp must be a numeric vector.")
}
kelvin <- ((temp - 32) * (5 / 9)) + 273.15
return(kelvin)
}
複数の状態や引数を検査する必要があると、全てを検査するためのコードは何行にも渡ります。
幸いなことに R は stopifnot
という便利な関数を提供しています。 TRUE
と評価されるべき要件を必要なだけ列挙すると、 stopifnot()
は一つでも FALSE がある場合にエラーを返します。
検査項目を列挙すると、追加のドキュメント化という2つ目の目的としても機能します。
stopifnot() を用いて fahr_to_kelvin()
に入力を検査するアサーション文を追加し、
防衛的プログラミングに挑戦しましょう。
temp が数値ベクトルであることをアサートしたいとします。
以下のようにしましょう。
R
fahr_to_kelvin <- function(temp) {
stopifnot(is.numeric(temp))
kelvin <- ((temp - 32) * (5 / 9)) + 273.15
return(kelvin)
}
入力が適切であればこれでも機能します。
R
# 水の凝固点 fahr_to_kelvin(temp = 32)
しかし不適切な入力があるとすぐに失敗します。
R
# Metric is a factor instead of numeric
fahr_to_kelvin(temp = as.factor(32))
エラー
Error in fahr_to_kelvin(temp = as.factor(32)): is.numeric(temp) is not TRUEチャレンジ3
防衛的プログラミングにより、fahr_to_celsius() 関数の
temp 引数に不適切な
値が指定されたらすぐにエラーを返すよう念押しして下さい。
チャレンジ3の解答 明示的に stopifnot()
を呼ぶことで先述の関数の定義を拡張しましょう。
fahr_to_celsius() は2つの他の関数から構成されているので、
ここでの検査は2つの関数の検査に追加され冗長になります。
R
fahr_to_celsius <- function(temp) {
stopifnot(is.numeric(temp))
temp_k <- fahr_to_kelvin(temp)
result <- kelvin_to_celsius(temp_k)
return(result)
}
もっと関数を組み合わせましょう
ここで我々のデータセットで利用できるデータからある国の国内総生産を計算するための関数を定義します。
R
# データセットを受け取り、人口の列と一人あたりのGDPをかけます。 calcGDP <- function(dat) { gdp <- dat$pop dat$gdpPercap return(gdp}
calcGDP() を定義するために、function
の結果を calcGDP に代入します。
引数の名前の一覧は括弧に中に書きます。 次に、本文 –
関数を読んだ時に実行される命令文 – は波括弧 ({})
の中に書きます。
本文中の命令文は2つのスペースでインデントしました。 これにより関数の動作に影響を及ぼさずに可読性を向上できます。
関数を呼び出す時に、関数に渡した値は引数に指定され、 関数の本文中における変数になります。
関数の中では return() 関数を用いて結果を返します。
return() 関数は必須ではなく、R は
関数の最終行で実行されたコマンドの結果を自動的に返します。
R
calcGDP(head(gapminder))
エラー
Error in calcGDP(head(gapminder)): could not find function "calcGDP"That’s not very informative. これでは情報に乏しいです。いくつか引数を追加して、年ごとと国ごとの情報を得られるようにしましょう。
R
# データセットを受け取り、人口の列と一人あたりのGDPの列をかけます。 calcGDP <- function(dat, year=NULL, country=NULL) { if(!is.null(year)) { dat <- dat[dat$year %in% year, ] } if (!is.null(country)) { dat <- dat[dat$country %in% country,] } gdp <- dat$pop dat$gdpPercap new <- cbind(dat, gdp=gdp) return(new}
もしこれらの関数を別の R スクリプトに書いているなら
(グッドアイディア!)、 source() 関数を使って関数を R
セッションに読み込むことができます。
R
source("functions/functions-lesson.R")
Ok, so there’s a lot going on in this function now. In plain English, the function now subsets the provided data by year if the year argument isn’t empty, then subsets the result by country if the country argument isn’t empty. Then it calculates the GDP for whatever subset emerges from the previous two steps. The function then adds the GDP as a new column to the subsetted data and returns this as the final result. You can see that the output is much more informative than a vector of numbers.
year を指定した時に何が起きるか見てみましょう。
R
head(calcGDP(gapminder, year=2007))
エラー
Error in calcGDP(gapminder, year = 2007): could not find function "calcGDP"また country を指定するとどうなるでしょうか。
R
calcGDP(gapminder, country="Australia")
エラー
Error in calcGDP(gapminder, country = "Australia"): could not find function "calcGDP"あるいは両方指定してみましょう。
R
calcGDP(gapminder, year=2007, country="Australia")
エラー
Error in calcGDP(gapminder, year = 2007, country = "Australia"): could not find function "calcGDP"関数の本文を順番に見ていきましょう。
ここで year と country
の二つの引数を追加しました。 =
演算子を関数定義時に用いることで、両者の 既定値 には NULL
を指定しています。
これにより、ユーザーが値を指定しない限り、これらの引数の値は
NULL になることを意味します。
R
if(!is.null(year)) {
dat <- dat[dat$year %in% year, ]
}
if (!is.null(country)) {
dat <- dat[dat$country %in% country,]
}
ここでは、追加した引数それぞれについて値が NULL
であるか確認し、 NULL でなければ dat
に格納されたデータセットを非 NULL
な引数の値を用いて絞り込み上書きします。
Building these conditionals into the function makes it more flexible for later. この関数を用いて、以下の様々な場合のGDPを計算できます。
- データセット全体
- ある年
- ある国
- ある年とある国の組み合わせ
代わりに %in% を使うことによって、year と
country に複数の値を指定できるようになっています。
Tip: 値渡し
Functions in R almost always make copies of the data to operate on
inside of a function body. When we modify dat inside the
function we are modifying the copy of the gapminder dataset stored in
dat, not the original variable we gave as the first
argument.
This is called “pass-by-value” and it makes writing code much safer: you can always be sure that whatever changes you make within the body of the function, stay inside the body of the function.
Tip: 関数のスコープ
Another important concept is scoping: any variables (or functions!)
you create or modify inside the body of a function only exist for the
lifetime of the function’s execution.
関数の本文中で作成したり変更したいかなる変数 (関数を含む!) は、
関数を実行している間だけ存在します。calcGDP()
を呼んだ時に、 dat、gdp、そして
new という変数は関数の本文中でのみ存在します。 対話的な R
のセッションにおいて同名の変数が存在していたとして、
それらは関数実行時に変更されることはありません。
Finally, we calculated the GDP on our new subset, and created a new data frame with that column added. 最終的に、絞り込んだデータからGDPを計算し、その結果を列に追加した新しいデータフレームを作成しました。 これは関数を呼び出した後でも返り値のGDPの値が持つ文脈がわかることを意味します。 従って、最初に試した数値のベクトルを返す方法よりもずっと良いものです。
チャレンジ4
GDP を計算する関数をテストするため、1987年の New Zealand の GDP を計算して下さい。 1952 年の New Zealand の GDP とはどう違いますか?
R
calcGDP(gapminder, year = c(1952, 1987), country = "New Zealand")
GDP for New Zealand in 1987: 65050008703
GDP for New Zealand in 1952: 21058193787
チャレンジ5
The paste() function can be used to combine text
together, e.g:
R
best_practice <- c("Write", "programs", "for", "people", "not", "computers")
paste(best_practice, collapse=" ")
出力
[1] "Write programs for people not computers"Write a function called fence() that takes two vectors
as arguments, called text and wrapper, and
prints out the text wrapped with the wrapper:
R
fence(text=best_practice, wrapper="***")
Note: the paste() function has an argument
called sep, which specifies the separator between text. The
default is a space: ” “. The default for paste0() is no
space”“.
Write a function called fence() that takes two vectors
as arguments, called text and wrapper, and
prints out the text wrapped with the wrapper:
R
fence <- function(text, wrapper){
text <- c(wrapper, text, wrapper)
result <- paste(text, collapse = " ")
return(result)
}
best_practice <- c("Write", "programs", "for", "people", "not", "computers")
fence(text=best_practice, wrapper="***")
出力
[1] "*** Write programs for people not computers ***"ヒント
R より複雑な演算を行う時に利用できる変わった機能があります。 ここでは発展的な概念を知っておく必要のあることは書きません。 将来的に R で関数を書くことに慣れたら、 R Language Manual や Hadley Wickham による Advanced R Programming のこの[章][]を読んで学んで下さい。
Tip: テストとドキュメント
It’s important to both test functions and document them: Documentation helps you, and others, understand what the purpose of your function is, and how to use it, and its important to make sure that your function actually does what you think.
When you first start out, your workflow will probably look a lot like this:
- Write a function
- Comment parts of the function to document its behaviour
- Load in the source file
- Experiment with it in the console to make sure it behaves as you expect
- Make any necessary bug fixes
- Rinse and repeat.
Formal documentation for functions, written in separate
.Rd files, gets turned into the documentation you see in
help files. The roxygen2
package allows R coders to write documentation alongside the function
code and then process it into the appropriate .Rd files.
You will want to switch to this more formal method of writing
documentation when you start writing more complicated R projects. In
fact, packages are, in essence, bundles of functions with this formal
documentation. Loading your own functions through
source("functions.R") is equivalent to loading someone
else’s functions (or your own one day!) through
library("package").
Formal automated tests can be written using the testthat package.
- Use
functionto define a new function in R. - Use parameters to pass values into functions.
- Use
stopifnot()to flexibly check function arguments in R. - Load functions into programs using
source().
Content from データの出力
最終更新日:2025-11-11 | ページの編集
概要
質問
- How can I save plots and data created in R?
目的
- To be able to write out plots and data from R.
Saving plots
ggsave 関数を使って、ggplot2
を用いて作った直近の図を保存する方法は既に学んだ通りです。
おさらいしておきましょう。
R
ggsave("My_most_recent_plot.pdf")
RStudio から図を保存するには “Plot” ウィンドウにある “Export” ボタンを使います。 この機能を使うと、図を .pdf や .png、.jpg など様々な画像形式で保存することができます。
図を “Plot” ウィンドウに表示することなく保存したいこともあるでしょう。 ページごとに一つの図を含むような複数のページから成る PDF を出力したいこともあるでしょう。 あるいはループを使ってファイル中のデータの絞り込み条件を変えながら複数の図を作成していて、 一つずつ保存するためにいちいちループを止めて “Export” ボタンを押すことが不可能な場合もあるでしょう。
このような場合、より柔軟な方法を使います。 pdf
関数は新たに PDF デバイスを作ります。
この関数に引数を指定することで、サイズや解像度を調整できます。
R
~~~ pdf("Life_Exp_vs_time.pdf", width=12, height=4) ggplot(data=gapminder, aes(x=year, y=lifeExp, colour=country)) + geom_line() + theme(legend.position = "none") # PDF デバイスを確実に終了しておく必要があります!このドキュメントを開いて内容を確認してみましょう。
チャレンジ1
Rewrite your ‘pdf’ command to print a second page in the pdf, showing
a facet plot (hint: use facet_grid) of the same data with
one panel per continent.
R
pdf("Life_Exp_vs_time.pdf", width = 12, height = 4)
p <- ggplot(data = gapminder, aes(x = year, y = lifeExp, colour = country)) +
geom_line() +
theme(legend.position = "none")
p
p + facet_grid(~continent)
dev.off()
同様にして jepg や png
などのコマンドを使うことで、他の形式のドキュメントを作成できます。
データの出力
R からデータを出力したいこともあります。
これには、既に使った read.table 関数とよく似た
write.table 関数を使います。
データを綺麗にするスクリプトを書きましょう。 今回の分析では、gapminder データの中のオーストラリアに該当する部分だけを使います。
R
aust_subset <- gapminder[gapminder$country == "Australia",]
write.table(aust_subset,
file="cleaned-data/gapminder-aus.csv",
sep=","
)
シェルに戻ってデータが正しく出力されているか確認しましょうOK:
出力
"country","year","pop","continent","lifeExp","gdpPercap"
"61","Australia",1952,8691212,"Oceania",69.12,10039.59564
"62","Australia",1957,9712569,"Oceania",70.33,10949.64959
"63","Australia",1962,10794968,"Oceania",70.93,12217.22686
"64","Australia",1967,11872264,"Oceania",71.1,14526.12465
"65","Australia",1972,13177000,"Oceania",71.93,16788.62948
"66","Australia",1977,14074100,"Oceania",73.49,18334.19751
"67","Australia",1982,15184200,"Oceania",74.74,19477.00928
"68","Australia",1987,16257249,"Oceania",76.32,21888.88903
"69","Australia",1992,17481977,"Oceania",77.56,23424.76683Hmm, that’s not quite what we wanted. Where did all these quotation marks come from? Also the row numbers are meaningless.
ヘルプファイルを見てこの動作を変更しましょう。
R
?write.table
既定では、R は文字列をファイルに出力する時に引用符で囲みます。 また、行と列の名前も出力します。
以下のように修正しましょう。
R
write.table(
gapminder[gapminder$country == "Australia",],
file="cleaned-data/gapminder-aus.csv",
sep=",", quote=FALSE, row.names=FALSE
)
もう一度シェルを使ってデータを確認してみましょう。
出力
country,year,pop,continent,lifeExp,gdpPercap
Australia,1952,8691212,Oceania,69.12,10039.59564
Australia,1957,9712569,Oceania,70.33,10949.64959
Australia,1962,10794968,Oceania,70.93,12217.22686
Australia,1967,11872264,Oceania,71.1,14526.12465
Australia,1972,13177000,Oceania,71.93,16788.62948
Australia,1977,14074100,Oceania,73.49,18334.19751
Australia,1982,15184200,Oceania,74.74,19477.00928
Australia,1987,16257249,Oceania,76.32,21888.88903
Australia,1992,17481977,Oceania,77.56,23424.76683よくなりました!
チャレンジ2
gapminder データを1990年以降のデータのみに絞り込むスクリプトを書いて下さい。
このスクリプトを使って絞り込んだ結果を cleaned-data/
ディレクトリ中のファイルに出力しましょう。
R
チャレンジ1990の解答 ~~~ write.table( gapminder[gapminder$year , ], file = "cleaned-data/gapminder-after1990.csv", sep = ",", quote = FALSE, row.names = FALSE)
- Save plots from RStudio using the ‘Export’ button.
- Use
write.tableto save tabular data.
Content from Data Frame Manipulation with dplyr
最終更新日:2025-11-11 | ページの編集
概要
質問
- How can I manipulate data frames without repeating myself?
目的
- To be able to use the six main data frame manipulation ‘verbs’ with
pipes in
dplyr. - To understand how
group_by()andsummarize()can be combined to summarize datasets. - Be able to analyze a subset of data using logical filtering.
多くの研究者にとって、データフレームの操作は、多くのことを意味します。 よくあるのは、特定の観測値(行)もしくは変数(列)の選択、 特定の変数でのデータのグループ化、 更には要約する統計値の計算です。 これらは、普通のRの基本操作で実行できます: We can do these operations using the normal base R operations:
R
mean(gapminder$gdpPercap[gapminder$continent == "Africa"])
出力
[1] 2193.755R
mean(gapminder$gdpPercap[gapminder$continent == "Americas"])
出力
[1] 7136.11R
mean(gapminder$gdpPercap[gapminder$continent == "Asia"])
出力
[1] 7902.15でも、これはあまり おススメ ではありません。繰り返しがかなりあるからです。 繰り返し作業は、時間を食います。そして、嫌なバグを起こる原因にもなりえます。
dplyr パッケージ
嬉しいことに、dplyr
パッケージには、データフレーム操作に非常に役立つ関数がいくつもあります。
それを使うと、先ほどみたような繰り返しを減らし、エラーを起こす確率を減らし、
タイピングする必要性さえも恐らく減らせます。 更には、dplyr
の書き方は、とても分かりやすいかもしれません。 As an added bonus, you
might even find the dplyr grammar easier to read.
Tip: Tidyverse
dplyr package belongs to a broader family of opinionated
R packages designed for data science called the “Tidyverse”. These
packages are specifically designed to work harmoniously together. Some
of these packages will be covered along this course, but you can find
more complete information here: https://www.tidyverse.org/.
ここでは、特によく使われる6つの関数と、
それらを組み合わせるためのパイプ(% %)を紹介します。 .
select()filter()group_by()summarize()mutate()
もし、このパッケージをまだインストールしていないようでしたら、ここでしておきましょう:
R
install.packages('dplyr')
パッケージをロードしましょう:
R
library("dplyr")
select() の使用
例えば、
データフレームにある、いくつかの変数だけを使って進めたい場合、
使えるかもしれないのは、select() 関数です。
これを使えば、選択した変数だけをキープすることができます。
R
year_country_gdp <- select(gapminder, year, country, gdpPercap)
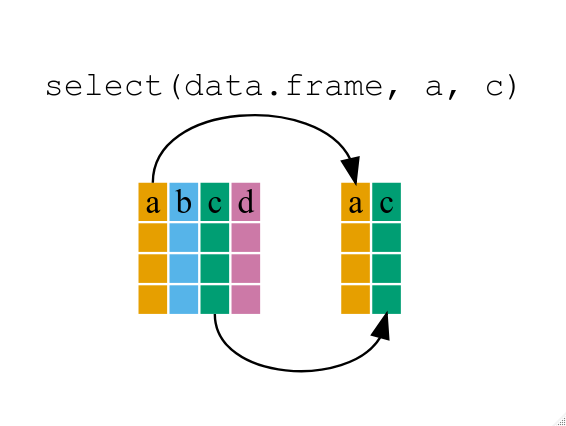 If we want to remove one column only from the
 gapminder
data, for example, removing the continent column.
R
smaller_gapminder_data <- select(gapminder, -continent)
もし year_country_gdp を開いたら、year、country 及び
gdpPercap しかないでしょう。 これまでは、 ‘普通の’
書き方を使いましたが、dplyr の強みは、複数の関数を
パイプを使って、組み合わせられることです。
パイプの書き方は、これまでRで見てきたものとは、
全く違いますので、上記でしたことをパイプを使って、やってみましょう。
R
year_country_gdp <- gapminder %>% select(year, country, gdpPercap)
To help you understand why we wrote that in that way, let’s walk
through it step by step. First we summon the gapminder data frame and
pass it on, using the pipe symbol %>%, to the next step,
which is the select() function. In this case we don’t
specify which data object we use in the select() function
since in gets that from the previous pipe. Fun Fact:
There is a good chance you have encountered pipes before in the shell.
In R, a pipe symbol is %>% while in the shell it is
| but the concept is the same!
Tip: Renaming data frame columns in dplyr
In Chapter 4 we covered how you can rename columns with base R by
assigning a value to the output of the names() function.
Just like select, this is a bit cumbersome, but thankfully dplyr has a
rename() function.
Within a pipeline, the syntax is
rename(new_name = old_name). For example, we may want to
rename the gdpPercap column name from our select()
statement above.
R
tidy_gdp <- year_country_gdp %>% rename(gdp_per_capita = gdpPercap)
head(tidy_gdp)
出力
year country gdp_per_capita
1 1952 Afghanistan 779.4453
2 1957 Afghanistan 820.8530
3 1962 Afghanistan 853.1007
4 1967 Afghanistan 836.1971
5 1972 Afghanistan 739.9811
6 1977 Afghanistan 786.1134filter() の使用
欧州のみで、上記を進めたいとしたら、 select と
filter を組み合わせましょう。
R
year_country_gdp_euro <- gapminder %>%
filter(continent == "Europe") %>%
select(year, country, gdpPercap)
If we now want to show life expectancy of European countries but only for a specific year (e.g., 2007), we can do as below.
R
europe_lifeExp_2007 <- gapminder %>%
filter(continent == "Europe", year == 2007) %>%
select(country, lifeExp)
チャレンジ1
Write a single command (which can span multiple lines and includes
pipes) that will produce a data frame that has the African values for
lifeExp, country and year, but
not for other Continents. How many rows does your data frame have and
why?
R
year_country_lifeExp_Africa <- gapminder %>%
filter(continent == "Africa") %>%
select(year, country, lifeExp)
以前行ったように、gapminder データフレームを filter()
関数に引き渡し、 フィルターされた バージョンのgapminder
データフレームを、 select() 関数に引き渡します。 注意:
ここでは、操作手順がとても重要です。 まず ‘select’
を使うと、その前のステップで、大陸の変数が削除されているため、 filter
で大陸の変数を見つけることができないことでしょう。
Using group_by()
Now, we were supposed to be reducing the error prone repetitiveness
of what can be done with base R, but up to now we haven’t done that
since we would have to repeat the above for each continent. Instead of
filter(), which will only pass observations that meet your
criteria (in the above: continent=="Europe"), we can use
group_by(), which will essentially use every unique
criteria that you could have used in filter.
R
str(gapminder)
出力
'data.frame': 1704 obs. of 6 variables:
$ country : chr "Afghanistan" "Afghanistan" "Afghanistan" "Afghanistan" ...
$ year : int 1952 1957 1962 1967 1972 1977 1982 1987 1992 1997 ...
$ pop : num 8425333 9240934 10267083 11537966 13079460 ...
$ continent: chr "Asia" "Asia" "Asia" "Asia" ...
$ lifeExp : num 28.8 30.3 32 34 36.1 ...
$ gdpPercap: num 779 821 853 836 740 ...R
str(gapminder %>% group_by(continent))
出力
gropd_df [1,704 × 6] (S3: grouped_df/tbl_df/tbl/data.frame)
$ country : chr [1:1704] "Afghanistan" "Afghanistan" "Afghanistan" "Afghanistan" ...
$ year : int [1:1704] 1952 1957 1962 1967 1972 1977 1982 1987 1992 1997 ...
$ pop : num [1:1704] 8425333 9240934 10267083 11537966 13079460 ...
$ continent: chr [1:1704] "Asia" "Asia" "Asia" "Asia" ...
$ lifeExp : num [1:1704] 28.8 30.3 32 34 36.1 ...
$ gdpPercap: num [1:1704] 779 821 853 836 740 ...
- attr(*, "groups")= tibble [5 × 2] (S3: tbl_df/tbl/data.frame)
..$ continent: chr [1:5] "Africa" "Americas" "Asia" "Europe" ...
..$ .rows : list<int> [1:5]
.. ..$ : int [1:624] 25 26 27 28 29 30 31 32 33 34 ...
.. ..$ : int [1:300] 49 50 51 52 53 54 55 56 57 58 ...
.. ..$ : int [1:396] 1 2 3 4 5 6 7 8 9 10 ...
.. ..$ : int [1:360] 13 14 15 16 17 18 19 20 21 22 ...
.. ..$ : int [1:24] 61 62 63 64 65 66 67 68 69 70 ...
.. ..@ ptype: int(0)
..- attr(*, ".drop")= logi TRUEgroup_by()
(grouped_df)で用いたデータフレームのデータ構造は、もともとの
gapminder
(data.frame)とは異なることに気づいたことでしょう。
grouped_df は、 list のようなものです。その
list にある各項目は、 (少なくとも上記の例では)特定の
continent の値が対応する列のみを含む
data.frame になります。
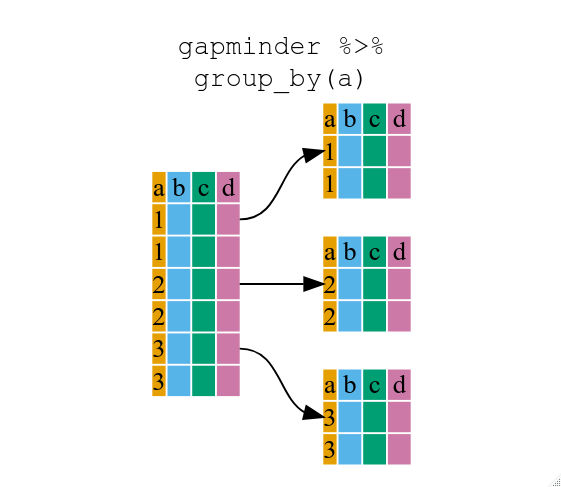
summarize() の使用
The above was a bit on the uneventful side but
group_by() is much more exciting in conjunction with
summarize(). This will allow us to create new variable(s)
by using functions that repeat for each of the continent-specific data
frames. That is to say, using the group_by() function, we
split our original data frame into multiple pieces, then we can run
functions (e.g. mean() or sd()) within
summarize().
R
gdp_bycontinents <- gapminder %>%
group_by(continent) %>%
summarize(mean_gdpPercap = mean(gdpPercap))
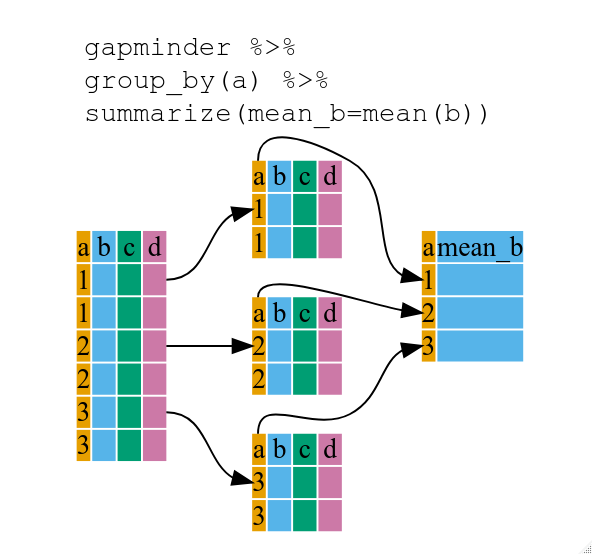
R
continent mean_gdpPercap
<fctr> <dbl>
1 Africa 2193.755
2 Americas 7136.110
3 Asia 7902.150
4 Europe 14469.476
5 Oceania 18621.609これにより、それぞれの大陸の平均gdpPercapを計算することができますが、 更に、すばらしいことがあるのです。
チャレンジ2
Calculate the average life expectancy per country. Which has the longest average life expectancy and which has the shortest average life expectancy?
R
lifeExp_bycountry <- gapminder %>%
group_by(country) %>%
summarize(mean_lifeExp = mean(lifeExp))
lifeExp_bycountry %>%
filter(mean_lifeExp == min(mean_lifeExp) | mean_lifeExp == max(mean_lifeExp))
出力
# A tibble: 2 × 2
country mean_lifeExp
<chr> <dbl>
1 Iceland 76.5
2 Sierra Leone 36.8Another way to do this is to use the dplyr function
arrange(), which arranges the rows in a data frame
according to the order of one or more variables from the data frame. It
has similar syntax to other functions from the dplyr
package. You can use desc() inside arrange()
to sort in descending order.
R
lifeExp_bycountry %>%
arrange(mean_lifeExp) %>%
head(1)
出力
# A tibble: 1 × 2
country mean_lifeExp
<chr> <dbl>
1 Sierra Leone 36.8R
lifeExp_bycountry %>%
arrange(desc(mean_lifeExp)) %>%
head(1)
出力
# A tibble: 1 × 2
country mean_lifeExp
<chr> <dbl>
1 Iceland 76.5Alphabetical order works too
R
lifeExp_bycountry %>%
arrange(desc(country)) %>%
head(1)
出力
# A tibble: 1 × 2
country mean_lifeExp
<chr> <dbl>
1 Zimbabwe 52.7group_by()
の関数では、複数の変数でグループ化するこもできます。 year
と continent でグループ分けしてみましょう。
R
gdp_bycontinents_byyear <- gapminder %>%
group_by(continent, year) %>%
summarize(mean_gdpPercap = mean(gdpPercap))
出力
`summarise()` has grouped output by 'continent'. You can override using the
`.groups` argument.That is already quite powerful, but it gets even better! You’re not
limited to defining 1 new variable in summarize().
R
gdp_pop_bycontinents_byyear <- gapminder %>%
group_by(continent, year) %>%
summarize(mean_gdpPercap = mean(gdpPercap),
sd_gdpPercap = sd(gdpPercap),
mean_pop = mean(pop),
sd_pop = sd(pop))
出力
`summarise()` has grouped output by 'continent'. You can override using the
`.groups` argument.count() 及び n()
A very common operation is to count the number of observations for
each group. The dplyr package comes with two related
functions that help with this.
例えば、2002年のデータセットにある国の数を確認したい場合、
count() 関数が使えます。
興味のあるグループのひとつかいくつかの行の名前を取り、
sort=TRUE
を加えることで、結果を降順に並べることもできます:
R
gapminder %>%
filter(year == 2002) %>%
count(continent, sort = TRUE)
出力
continent n
1 Africa 52
2 Asia 33
3 Europe 30
4 Americas 25
5 Oceania 2演算の際の観測値の数が必要な場合 n() 関数が使えます。 It
will return the total number of observations in the current group rather
than counting the number of observations in each group within a specific
column. 例えば、大陸別平均余命の標準誤差を得たいとします:
R
gapminder %>%
group_by(continent) %>%
summarize(se_le = sd(lifeExp)/sqrt(n()))
出力
# A tibble: 5 × 2
continent se_le
<chr> <dbl>
1 Africa 0.366
2 Americas 0.540
3 Asia 0.596
4 Europe 0.286
5 Oceania 0.775いくつかの要約計算を、つなぎ合わせることもできます。つまり、ここでは各大陸の国別平均余命の
minimum 、 maximum 、 mean 及び
se となります:
R
gapminder %>%
group_by(continent) %>%
summarize(
mean_le = mean(lifeExp),
min_le = min(lifeExp),
max_le = max(lifeExp),
se_le = sd(lifeExp)/sqrt(n()))
出力
# A tibble: 5 × 5
continent mean_le min_le max_le se_le
<chr> <dbl> <dbl> <dbl> <dbl>
1 Africa 48.9 23.6 76.4 0.366
2 Americas 64.7 37.6 80.7 0.540
3 Asia 60.1 28.8 82.6 0.596
4 Europe 71.9 43.6 81.8 0.286
5 Oceania 74.3 69.1 81.2 0.775mutate() の使用
情報を要約する前に(もしくは後にでも)、 mutate()
を使えば、新しい変数を作ることができます。
R
gdp_pop_bycontinents_byyear <- gapminder %>%
mutate(gdp_billion = gdpPercap*pop/10^9) %>%
group_by(continent,year) %>%
summarize(mean_gdpPercap = mean(gdpPercap),
sd_gdpPercap = sd(gdpPercap),
mean_pop = mean(pop),
sd_pop = sd(pop),
mean_gdp_billion = mean(gdp_billion),
sd_gdp_billion = sd(gdp_billion))
出力
`summarise()` has grouped output by 'continent'. You can override using the
`.groups` argument.論理フィルター ifelse とmutate の併用
新しい変数を作る時、論理条件を付けることができます。
似たような組み合わせの mutate() と ifelse()
は、まさに必要な場面、つまり
新しいものを作る時に、フィルターすることができます。
この簡単に読めるコードが、(データフレーム全体の次元を変えずに)あるデータを
排除するための早くて役に立つ方法であり、
与えられた条件によって値を更新する方法なのです。
R
## keeping all data but "filtering" after a certain condition
# calculate GDP only for people with a life expectation above 25
gdp_pop_bycontinents_byyear_above25 <- gapminder %>%
mutate(gdp_billion = ifelse(lifeExp > 25, gdpPercap * pop / 10^9, NA)) %>%
group_by(continent, year) %>%
summarize(mean_gdpPercap = mean(gdpPercap),
sd_gdpPercap = sd(gdpPercap),
mean_pop = mean(pop),
sd_pop = sd(pop),
mean_gdp_billion = mean(gdp_billion),
sd_gdp_billion = sd(gdp_billion))
出力
`summarise()` has grouped output by 'continent'. You can override using the
`.groups` argument.R
## updating only if certain condition is fullfilled
# for life expectations above 40 years, the gpd to be expected in the future is scaled
gdp_future_bycontinents_byyear_high_lifeExp <- gapminder %>%
mutate(gdp_futureExpectation = ifelse(lifeExp > 40, gdpPercap * 1.5, gdpPercap)) %>%
group_by(continent, year) %>%
summarize(mean_gdpPercap = mean(gdpPercap),
mean_gdpPercap_expected = mean(gdp_futureExpectation))
出力
`summarise()` has grouped output by 'continent'. You can override using the
`.groups` argument.
dplyr と ggplot2 の併用
First install and load ggplot2:
R
install.packages('ggplot2')
R
library("ggplot2")
プロットのレッスンでは、 ggplot2
を使って、ファセットパネルの層を加えることで、
複数パネルの図を示す方法を見ました。
以下が、(いくつかコメントを足してありますが)使用したコードです:
R
# Filter countries located in the Americas
americas <- gapminder[gapminder$continent == "Americas", ]
# Make the plot
ggplot(data = americas, mapping = aes(x = year, y = lifeExp)) +
geom_line() +
facet_wrap( ~ country) +
theme(axis.text.x = element_text(angle = 45))
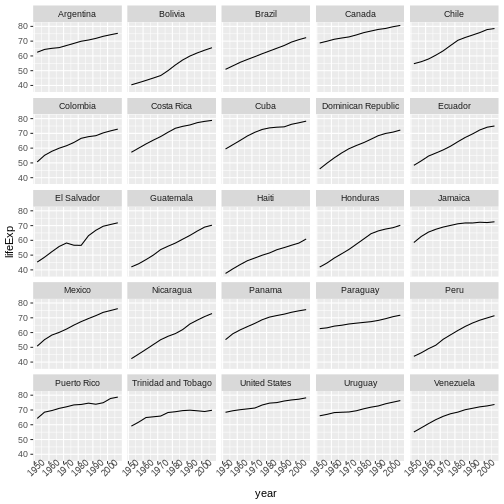
このコードは、正しいプロットを作りますが、他に使い道のない、変数(starts.with
及び az.countries)も作ります。 dplyr
関数のチェーンで、 % % を使って、
データをパイプしたように、 ggplot()
へデータを引き渡すこともできます。 なぜならば % %
は、関数の最初の引数を置き換えるため、 ggplot()
関数の中の、 data = 因数を指定する必要がありません。
dplyr と ggplot2
関数を組み合わせることで、同じ図を、新しい変数を作ったり、
データを修正することなく作成できます。
R
gapminder %>%
# Filter countries located in the Americas
filter(continent == "Americas") %>%
# Make the plot
ggplot(mapping = aes(x = year, y = lifeExp)) +
geom_line() +
facet_wrap( ~ country) +
theme(axis.text.x = element_text(angle = 45))
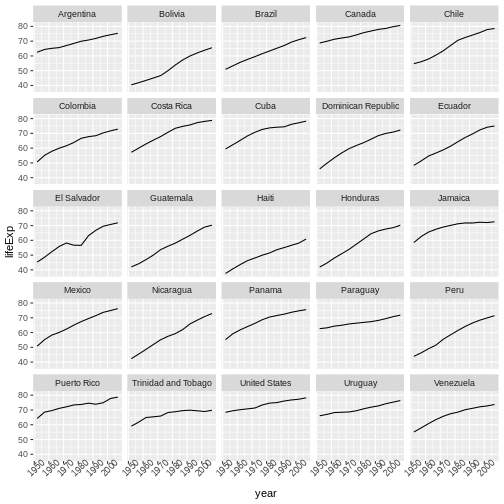
More examples of using the function mutate() and the
ggplot2 package.
R
gapminder %>%
# extract first letter of country name into new column
mutate(startsWith = substr(country, 1, 1)) %>%
# only keep countries starting with A or Z
filter(startsWith %in% c("A", "Z")) %>%
# plot lifeExp into facets
ggplot(aes(x = year, y = lifeExp, colour = continent)) +
geom_line() +
facet_wrap(vars(country)) +
theme_minimal()
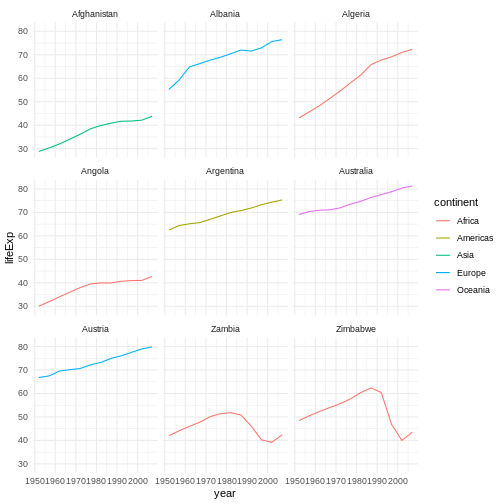
上級チャレンジ
各大陸から無作為に選ばれた2つの国の2002年の平均余命を計算し、
大陸名を、逆の順番に並べましょう。 ヒント: dplyr 関数
arrange() 及び sample_n() を使いましょう。
書き方は、他の dplyr 関数と同じです。
R
lifeExp_2countries_bycontinents <- gapminder %>%
filter(year==2002) %>%
group_by(continent) %>%
sample_n(2) %>%
summarize(mean_lifeExp=mean(lifeExp)) %>%
arrange(desc(mean_lifeExp))
その他役に立つ資料
- R for Data Science (online book)
- Data Wrangling Cheat sheet (pdf file)
- Introduction to dplyr (online documentation)
- Data wrangling with R and RStudio (online video)
- Tidyverse Skills for Data Science (online book)
- Use the
dplyrpackage to manipulate data frames. - Use
select()to choose variables from a data frame. - Use
filter()to choose data based on values. - Use
group_by()andsummarize()to work with subsets of data. - Use
mutate()to create new variables.
Content from Data Frame Manipulation with tidyr
最終更新日:2025-11-11 | ページの編集
概要
質問
- How can I change the layout of a data frame?
目的
- To understand the concepts of ‘longer’ and ‘wider’ data frame
formats and be able to convert between them with
tidyr.
研究者には「横長」データを「縦長」データに(又はその逆を)したいと 思うことがよくあります。 「縦長」形式とは:
- 各列が変数
- 各行が観測値
「縦長」形式では、普通、観測値は1列で、残りの列はIDの変数になります。
For the ‘wide’ format each row is often a site/subject/patient and
you have multiple observation variables containing the same type of
data. These can be either repeated observations over time, or
observation of multiple variables (or a mix of both). You may find data
input may be simpler or some other applications may prefer the ‘wide’
format. However, many of R‘s functions have been designed
assuming you have ’longer’ formatted data. This tutorial will help you
efficiently transform your data shape regardless of original format.
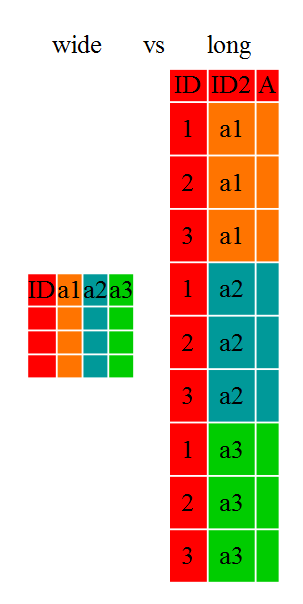
Long and wide data frame layouts mainly affect readability. For humans, the wide format is often more intuitive since we can often see more of the data on the screen due to its shape. However, the long format is more machine readable and is closer to the formatting of databases. The ID variables in our data frames are similar to the fields in a database and observed variables are like the database values.
手始めに
まず、パッケージをインストールしましょう、もしまだやっていなければですが (おそらく、前の dplyr のレッスンで、インストールしているかと思います):
R
#install.packages("tidyr")
#install.packages("dplyr")
パーッケージをロードしましょう。
R
library("tidyr")
library("dplyr")
始めに、そもそもの gapminder データフレームのデータ構造を見てみましょう:
R
str(gapminder)
出力
'data.frame': 1704 obs. of 6 variables:
$ country : chr "Afghanistan" "Afghanistan" "Afghanistan" "Afghanistan" ...
$ year : int 1952 1957 1962 1967 1972 1977 1982 1987 1992 1997 ...
$ pop : num 8425333 9240934 10267083 11537966 13079460 ...
$ continent: chr "Asia" "Asia" "Asia" "Asia" ...
$ lifeExp : num 28.8 30.3 32 34 36.1 ...
$ gdpPercap: num 779 821 853 836 740 ...チャレンジ1
gapminder は、横長のみ、縦長のみ、又はその中間の形式でしょうか。
チャレンジ1の解答 元々の gapminder data.frame は、中間の形式です。
複数の観測変数(pop,lifeExp,gdpPercap)があるため、
縦長のみのデータとは言えません。
Sometimes, as with the gapminder dataset, we have multiple types of
observed data. It is somewhere in between the purely ‘long’ and ‘wide’
data formats. We have 3 “ID variables” (continent,
country, year) and 3 “Observation variables”
(pop,lifeExp,gdpPercap). This
intermediate format can be preferred despite not having ALL observations
in 1 column given that all 3 observation variables have different units.
There are few operations that would need us to make this data frame any
longer (i.e. 4 ID variables and 1 Observation variable).
While using many of the functions in R, which are often vector based,
you usually do not want to do mathematical operations on values with
different units. For example, using the purely long format, a single
mean for all of the values of population, life expectancy, and GDP would
not be meaningful since it would return the mean of values with 3
incompatible units. The solution is that we first manipulate the data
either by grouping (see the lesson on dplyr), or we change
the structure of the data frame. Note: Some plotting
functions in R actually work better in the wide format data.
gather() を使って、横長から縦長形式へ
Until now, we’ve been using the nicely formatted original gapminder dataset, but ‘real’ data (i.e. our own research data) will never be so well organized. Here let’s start with the wide formatted version of the gapminder dataset.
Download the wide version of the gapminder data from this link to a csv file and save it in your data folder.
We’ll load the data file and look at it.
データファイルをロードして見てみましょう。
注:大陸と国の列は、因子型にはしたくありません。
そこで、そうならないように、read.csv()に stringsAsFactors
引数を使いましょう。
R
gap_wide <- read.csv("data/gapminder_wide.csv", stringsAsFactors = FALSE)
str(gap_wide)
出力
'data.frame': 142 obs. of 38 variables:
$ continent : chr "Africa" "Africa" "Africa" "Africa" ...
$ country : chr "Algeria" "Angola" "Benin" "Botswana" ...
$ gdpPercap_1952: num 2449 3521 1063 851 543 ...
$ gdpPercap_1957: num 3014 3828 960 918 617 ...
$ gdpPercap_1962: num 2551 4269 949 984 723 ...
$ gdpPercap_1967: num 3247 5523 1036 1215 795 ...
$ gdpPercap_1972: num 4183 5473 1086 2264 855 ...
$ gdpPercap_1977: num 4910 3009 1029 3215 743 ...
$ gdpPercap_1982: num 5745 2757 1278 4551 807 ...
$ gdpPercap_1987: num 5681 2430 1226 6206 912 ...
$ gdpPercap_1992: num 5023 2628 1191 7954 932 ...
$ gdpPercap_1997: num 4797 2277 1233 8647 946 ...
$ gdpPercap_2002: num 5288 2773 1373 11004 1038 ...
$ gdpPercap_2007: num 6223 4797 1441 12570 1217 ...
$ lifeExp_1952 : num 43.1 30 38.2 47.6 32 ...
$ lifeExp_1957 : num 45.7 32 40.4 49.6 34.9 ...
$ lifeExp_1962 : num 48.3 34 42.6 51.5 37.8 ...
$ lifeExp_1967 : num 51.4 36 44.9 53.3 40.7 ...
$ lifeExp_1972 : num 54.5 37.9 47 56 43.6 ...
$ lifeExp_1977 : num 58 39.5 49.2 59.3 46.1 ...
$ lifeExp_1982 : num 61.4 39.9 50.9 61.5 48.1 ...
$ lifeExp_1987 : num 65.8 39.9 52.3 63.6 49.6 ...
$ lifeExp_1992 : num 67.7 40.6 53.9 62.7 50.3 ...
$ lifeExp_1997 : num 69.2 41 54.8 52.6 50.3 ...
$ lifeExp_2002 : num 71 41 54.4 46.6 50.6 ...
$ lifeExp_2007 : num 72.3 42.7 56.7 50.7 52.3 ...
$ pop_1952 : num 9279525 4232095 1738315 442308 4469979 ...
$ pop_1957 : num 10270856 4561361 1925173 474639 4713416 ...
$ pop_1962 : num 11000948 4826015 2151895 512764 4919632 ...
$ pop_1967 : num 12760499 5247469 2427334 553541 5127935 ...
$ pop_1972 : num 14760787 5894858 2761407 619351 5433886 ...
$ pop_1977 : num 17152804 6162675 3168267 781472 5889574 ...
$ pop_1982 : num 20033753 7016384 3641603 970347 6634596 ...
$ pop_1987 : num 23254956 7874230 4243788 1151184 7586551 ...
$ pop_1992 : num 26298373 8735988 4981671 1342614 8878303 ...
$ pop_1997 : num 29072015 9875024 6066080 1536536 10352843 ...
$ pop_2002 : int 31287142 10866106 7026113 1630347 12251209 7021078 15929988 4048013 8835739 614382 ...
$ pop_2007 : int 33333216 12420476 8078314 1639131 14326203 8390505 17696293 4369038 10238807 710960 ...
To change this very wide data frame layout back to our nice,
intermediate (or longer) layout, we will use one of the two available
pivot functions from the tidyr package. To
convert from wide to a longer format, we will use the
pivot_longer() function. pivot_longer() makes
datasets longer by increasing the number of rows and decreasing the
number of columns, or ‘lengthening’ your observation variables into a
single variable.
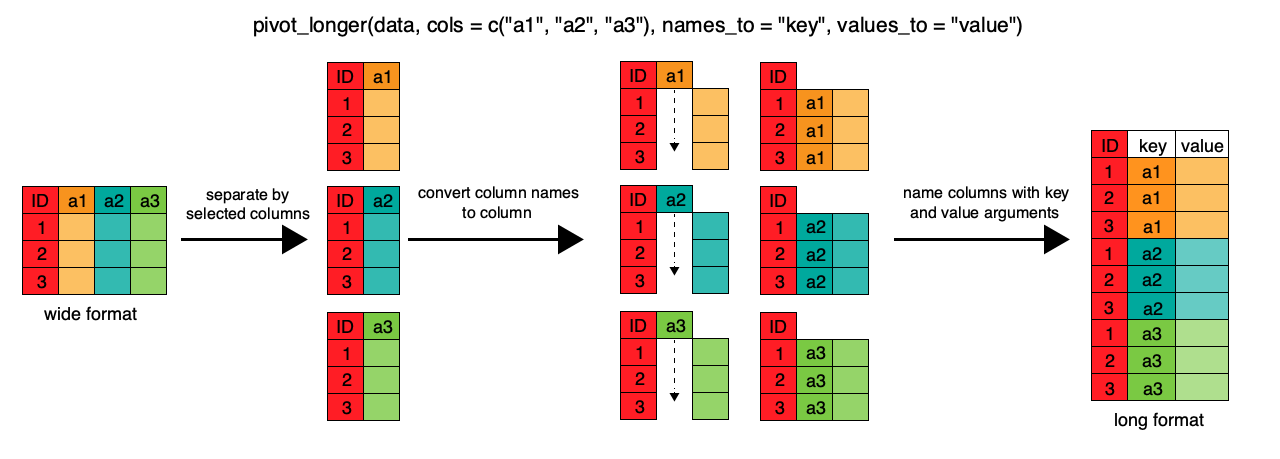
R
gap_long <- gap_wide %>%
pivot_longer(
cols = c(starts_with('pop'), starts_with('lifeExp'), starts_with('gdpPercap')),
names_to = "obstype_year", values_to = "obs_values"
)
str(gap_long)
出力
tibble [5,112 × 4] (S3: tbl_df/tbl/data.frame)
$ continent : chr [1:5112] "Africa" "Africa" "Africa" "Africa" ...
$ country : chr [1:5112] "Algeria" "Algeria" "Algeria" "Algeria" ...
$ obstype_year: chr [1:5112] "pop_1952" "pop_1957" "pop_1962" "pop_1967" ...
$ obs_values : num [1:5112] 9279525 10270856 11000948 12760499 14760787 ...ここでは、以前 dplyr のレッスンの中で行ったようなパイプの書き方を使いました。 実は、tidyr と dplyr 関数は互換性があり、パイプで繋ぐことで、一緒に使うことが できるのです。
We first provide to pivot_longer() a vector of column
names that will be pivoted into longer format. We could type out all the
observation variables, but as in the select() function (see
dplyr lesson), we can use the starts_with()
argument to select all variables that start with the desired character
string. pivot_longer() also allows the alternative syntax
of using the - symbol to identify which variables are not
to be pivoted (i.e. ID variables).
The next arguments to pivot_longer() are
names_to for naming the column that will contain the new ID
variable (obstype_year) and values_to for
naming the new amalgamated observation variable
(obs_value). We supply these new column names as
strings.
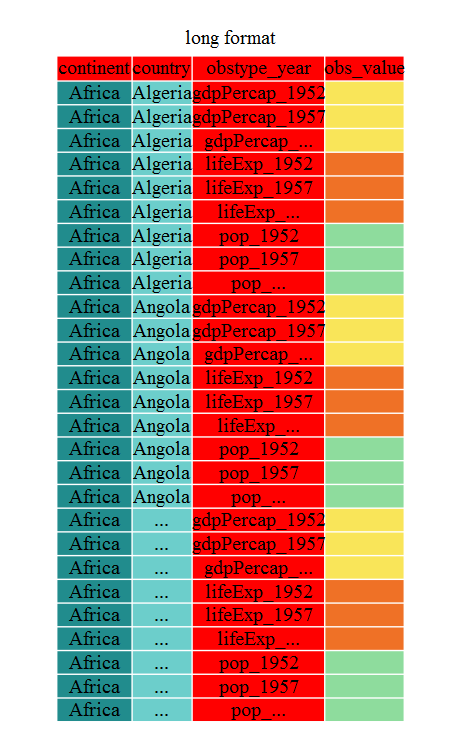
R
gap_long <- gap_wide %>%
pivot_longer(
cols = c(-continent, -country),
names_to = "obstype_year", values_to = "obs_values"
)
str(gap_long)
出力
tibble [5,112 × 4] (S3: tbl_df/tbl/data.frame)
$ continent : chr [1:5112] "Africa" "Africa" "Africa" "Africa" ...
$ country : chr [1:5112] "Algeria" "Algeria" "Algeria" "Algeria" ...
$ obstype_year: chr [1:5112] "gdpPercap_1952" "gdpPercap_1957" "gdpPercap_1962" "gdpPercap_1967" ...
$ obs_values : num [1:5112] 2449 3014 2551 3247 4183 ...これは、このデータフレームでは、取るに足らないことかもしれませんが、 1つの ID 変数と40の変則的な変数名を持つ観測変数がある場合も時にはあります。 柔軟性があることで、かなり時間が節約できるのです!
Now obstype_year actually contains 2 pieces of
information, the observation type
(pop,lifeExp, or gdpPercap) and
the year. We can use the separate() function
to split the character strings into multiple variables
R
gap_long <- gap_long %>% separate(obstype_year, into = c('obs_type', 'year'), sep = "_")
gap_long$year <- as.integer(gap_long$year)
チャレンジ2
Using gap_long, calculate the mean life expectancy,
population, and gdpPercap for each continent. Hint: use
the group_by() and summarize() functions we
learned in the dplyr lesson
R
gap_long %>% group_by(continent, obs_type) %>%
summarize(means=mean(obs_values))
出力
`summarise()` has grouped output by 'continent'. You can override using the
`.groups` argument.出力
# A tibble: 15 × 3
# Groups: continent [5]
continent obs_type means
<chr> <chr> <dbl>
1 Africa gdpPercap 2194.
2 Africa lifeExp 48.9
3 Africa pop 9916003.
4 Americas gdpPercap 7136.
5 Americas lifeExp 64.7
6 Americas pop 24504795.
7 Asia gdpPercap 7902.
8 Asia lifeExp 60.1
9 Asia pop 77038722.
10 Europe gdpPercap 14469.
11 Europe lifeExp 71.9
12 Europe pop 17169765.
13 Oceania gdpPercap 18622.
14 Oceania lifeExp 74.3
15 Oceania pop 8874672. spread() で縦長から中間形式へ
It is always good to check work. So, let’s use the second
pivot function, pivot_wider(), to ‘widen’ our
observation variables back out. pivot_wider() is the
opposite of pivot_longer(), making a dataset wider by
increasing the number of columns and decreasing the number of rows. We
can use pivot_wider() to pivot or reshape our
gap_long to the original intermediate format or the widest
format. Let’s start with the intermediate format.
The pivot_wider() function takes names_from
and values_from arguments.
To names_from we supply the column name whose contents
will be pivoted into new output columns in the widened data frame. The
corresponding values will be added from the column named in the
values_from argument.
R
gap_normal <- gap_long %>%
pivot_wider(names_from = obs_type, values_from = obs_values)
dim(gap_normal)
出力
[1] 1704 6R
dim(gapminder)
出力
[1] 1704 6R
names(gap_normal)
出力
[1] "continent" "country" "year" "gdpPercap" "lifeExp" "pop" R
names(gapminder)
出力
[1] "country" "year" "pop" "continent" "lifeExp" "gdpPercap"元々の gapminder
と同じ次元を持つ、中間形式のデータフレーム gap_normal
ができましたが、 変数の順番が違います。 このふたつが、
all.equal() かを調べる前に、これを直しましょう。
R
gap_normal <- gap_normal[, names(gapminder)]
all.equal(gap_normal, gapminder)
出力
[1] "Attributes: < Component \"class\": Lengths (3, 1) differ (string compare on first 1) >"
[2] "Attributes: < Component \"class\": 1 string mismatch >"
[3] "Component \"country\": 1704 string mismatches"
[4] "Component \"pop\": Mean relative difference: 1.634504"
[5] "Component \"continent\": 1212 string mismatches"
[6] "Component \"lifeExp\": Mean relative difference: 0.203822"
[7] "Component \"gdpPercap\": Mean relative difference: 1.162302" R
head(gap_normal)
出力
# A tibble: 6 × 6
country year pop continent lifeExp gdpPercap
<chr> <int> <dbl> <chr> <dbl> <dbl>
1 Algeria 1952 9279525 Africa 43.1 2449.
2 Algeria 1957 10270856 Africa 45.7 3014.
3 Algeria 1962 11000948 Africa 48.3 2551.
4 Algeria 1967 12760499 Africa 51.4 3247.
5 Algeria 1972 14760787 Africa 54.5 4183.
6 Algeria 1977 17152804 Africa 58.0 4910.R
head(gapminder)
出力
country year pop continent lifeExp gdpPercap
1 Afghanistan 1952 8425333 Asia 28.801 779.4453
2 Afghanistan 1957 9240934 Asia 30.332 820.8530
3 Afghanistan 1962 10267083 Asia 31.997 853.1007
4 Afghanistan 1967 11537966 Asia 34.020 836.1971
5 Afghanistan 1972 13079460 Asia 36.088 739.9811
6 Afghanistan 1977 14880372 Asia 38.438 786.1134もうすぐです。元々のは、 country 、
continent 、そして year
でソートされていました。
R
gap_normal <- gap_normal %>% arrange(country, year)
all.equal(gap_normal, gapminder)
出力
[1] "Attributes: < Component \"class\": Lengths (3, 1) differ (string compare on first 1) >"
[2] "Attributes: < Component \"class\": 1 string mismatch >" That’s great! すばらしい!一番縦に長い形式から、中間形式に戻し、コードにエラーが でることもありませんでした。
Now let’s convert the long all the way back to the wide. In the wide
format, we will keep country and continent as ID variables and pivot the
observations across the 3 metrics
(pop,lifeExp,gdpPercap) and time
(year). First we need to create appropriate labels for all
our new variables (time*metric combinations) and we also need to unify
our ID variables to simplify the process of defining
gap_wide.
R
gap_temp <- gap_long %>% unite(var_ID, continent, country, sep = "_")
str(gap_temp)
出力
tibble [5,112 × 4] (S3: tbl_df/tbl/data.frame)
$ var_ID : chr [1:5112] "Africa_Algeria" "Africa_Algeria" "Africa_Algeria" "Africa_Algeria" ...
$ obs_type : chr [1:5112] "gdpPercap" "gdpPercap" "gdpPercap" "gdpPercap" ...
$ year : int [1:5112] 1952 1957 1962 1967 1972 1977 1982 1987 1992 1997 ...
$ obs_values: num [1:5112] 2449 3014 2551 3247 4183 ...R
gap_temp <- gap_long %>%
unite(ID_var, continent, country, sep = "_") %>%
unite(var_names, obs_type, year, sep = "_")
str(gap_temp)
出力
tibble [5,112 × 3] (S3: tbl_df/tbl/data.frame)
$ ID_var : chr [1:5112] "Africa_Algeria" "Africa_Algeria" "Africa_Algeria" "Africa_Algeria" ...
$ var_names : chr [1:5112] "gdpPercap_1952" "gdpPercap_1957" "gdpPercap_1962" "gdpPercap_1967" ...
$ obs_values: num [1:5112] 2449 3014 2551 3247 4183 ...unite()
を使い、continentとcountryを組み合わせ、ID
変数をひとつ作り、 変数名を定義しました。 spread()
でパイプを使う準備が整いました。
R
gap_wide_new <- gap_long %>%
unite(ID_var, continent, country, sep = "_") %>%
unite(var_names, obs_type, year, sep = "_") %>%
pivot_wider(names_from = var_names, values_from = obs_values)
str(gap_wide_new)
出力
tibble [142 × 37] (S3: tbl_df/tbl/data.frame)
$ ID_var : chr [1:142] "Africa_Algeria" "Africa_Angola" "Africa_Benin" "Africa_Botswana" ...
$ gdpPercap_1952: num [1:142] 2449 3521 1063 851 543 ...
$ gdpPercap_1957: num [1:142] 3014 3828 960 918 617 ...
$ gdpPercap_1962: num [1:142] 2551 4269 949 984 723 ...
$ gdpPercap_1967: num [1:142] 3247 5523 1036 1215 795 ...
$ gdpPercap_1972: num [1:142] 4183 5473 1086 2264 855 ...
$ gdpPercap_1977: num [1:142] 4910 3009 1029 3215 743 ...
$ gdpPercap_1982: num [1:142] 5745 2757 1278 4551 807 ...
$ gdpPercap_1987: num [1:142] 5681 2430 1226 6206 912 ...
$ gdpPercap_1992: num [1:142] 5023 2628 1191 7954 932 ...
$ gdpPercap_1997: num [1:142] 4797 2277 1233 8647 946 ...
$ gdpPercap_2002: num [1:142] 5288 2773 1373 11004 1038 ...
$ gdpPercap_2007: num [1:142] 6223 4797 1441 12570 1217 ...
$ lifeExp_1952 : num [1:142] 43.1 30 38.2 47.6 32 ...
$ lifeExp_1957 : num [1:142] 45.7 32 40.4 49.6 34.9 ...
$ lifeExp_1962 : num [1:142] 48.3 34 42.6 51.5 37.8 ...
$ lifeExp_1967 : num [1:142] 51.4 36 44.9 53.3 40.7 ...
$ lifeExp_1972 : num [1:142] 54.5 37.9 47 56 43.6 ...
$ lifeExp_1977 : num [1:142] 58 39.5 49.2 59.3 46.1 ...
$ lifeExp_1982 : num [1:142] 61.4 39.9 50.9 61.5 48.1 ...
$ lifeExp_1987 : num [1:142] 65.8 39.9 52.3 63.6 49.6 ...
$ lifeExp_1992 : num [1:142] 67.7 40.6 53.9 62.7 50.3 ...
$ lifeExp_1997 : num [1:142] 69.2 41 54.8 52.6 50.3 ...
$ lifeExp_2002 : num [1:142] 71 41 54.4 46.6 50.6 ...
$ lifeExp_2007 : num [1:142] 72.3 42.7 56.7 50.7 52.3 ...
$ pop_1952 : num [1:142] 9279525 4232095 1738315 442308 4469979 ...
$ pop_1957 : num [1:142] 10270856 4561361 1925173 474639 4713416 ...
$ pop_1962 : num [1:142] 11000948 4826015 2151895 512764 4919632 ...
$ pop_1967 : num [1:142] 12760499 5247469 2427334 553541 5127935 ...
$ pop_1972 : num [1:142] 14760787 5894858 2761407 619351 5433886 ...
$ pop_1977 : num [1:142] 17152804 6162675 3168267 781472 5889574 ...
$ pop_1982 : num [1:142] 20033753 7016384 3641603 970347 6634596 ...
$ pop_1987 : num [1:142] 23254956 7874230 4243788 1151184 7586551 ...
$ pop_1992 : num [1:142] 26298373 8735988 4981671 1342614 8878303 ...
$ pop_1997 : num [1:142] 29072015 9875024 6066080 1536536 10352843 ...
$ pop_2002 : num [1:142] 31287142 10866106 7026113 1630347 12251209 ...
$ pop_2007 : num [1:142] 33333216 12420476 8078314 1639131 14326203 ...チャレンジ3
この一つ先に進み、 gap_ludicrously_wide
を作り、国、年及び3つの行列に展開したデータを作りましょう。 ヒント
この新しいデータフレームには、5行しかありません。
R
gap_ludicrously_wide <- gap_long %>%
unite(var_names, obs_type, year, country, sep = "_") %>%
pivot_wider(names_from = var_names, values_from = obs_values)
今、とても ‘横長な’ 形式のデータフレームがありますが、
ID_var は、より使えるようにできるはずです。
separate() を使って、2変数に分けてみましょう。
R
gap_wide_betterID <- separate(gap_wide_new, ID_var, c("continent", "country"), sep="_")
gap_wide_betterID <- gap_long %>%
unite(ID_var, continent, country, sep = "_") %>%
unite(var_names, obs_type, year, sep = "_") %>%
pivot_wider(names_from = var_names, values_from = obs_values) %>%
separate(ID_var, c("continent","country"), sep = "_")
str(gap_wide_betterID)
出力
tibble [142 × 38] (S3: tbl_df/tbl/data.frame)
$ continent : chr [1:142] "Africa" "Africa" "Africa" "Africa" ...
$ country : chr [1:142] "Algeria" "Angola" "Benin" "Botswana" ...
$ gdpPercap_1952: num [1:142] 2449 3521 1063 851 543 ...
$ gdpPercap_1957: num [1:142] 3014 3828 960 918 617 ...
$ gdpPercap_1962: num [1:142] 2551 4269 949 984 723 ...
$ gdpPercap_1967: num [1:142] 3247 5523 1036 1215 795 ...
$ gdpPercap_1972: num [1:142] 4183 5473 1086 2264 855 ...
$ gdpPercap_1977: num [1:142] 4910 3009 1029 3215 743 ...
$ gdpPercap_1982: num [1:142] 5745 2757 1278 4551 807 ...
$ gdpPercap_1987: num [1:142] 5681 2430 1226 6206 912 ...
$ gdpPercap_1992: num [1:142] 5023 2628 1191 7954 932 ...
$ gdpPercap_1997: num [1:142] 4797 2277 1233 8647 946 ...
$ gdpPercap_2002: num [1:142] 5288 2773 1373 11004 1038 ...
$ gdpPercap_2007: num [1:142] 6223 4797 1441 12570 1217 ...
$ lifeExp_1952 : num [1:142] 43.1 30 38.2 47.6 32 ...
$ lifeExp_1957 : num [1:142] 45.7 32 40.4 49.6 34.9 ...
$ lifeExp_1962 : num [1:142] 48.3 34 42.6 51.5 37.8 ...
$ lifeExp_1967 : num [1:142] 51.4 36 44.9 53.3 40.7 ...
$ lifeExp_1972 : num [1:142] 54.5 37.9 47 56 43.6 ...
$ lifeExp_1977 : num [1:142] 58 39.5 49.2 59.3 46.1 ...
$ lifeExp_1982 : num [1:142] 61.4 39.9 50.9 61.5 48.1 ...
$ lifeExp_1987 : num [1:142] 65.8 39.9 52.3 63.6 49.6 ...
$ lifeExp_1992 : num [1:142] 67.7 40.6 53.9 62.7 50.3 ...
$ lifeExp_1997 : num [1:142] 69.2 41 54.8 52.6 50.3 ...
$ lifeExp_2002 : num [1:142] 71 41 54.4 46.6 50.6 ...
$ lifeExp_2007 : num [1:142] 72.3 42.7 56.7 50.7 52.3 ...
$ pop_1952 : num [1:142] 9279525 4232095 1738315 442308 4469979 ...
$ pop_1957 : num [1:142] 10270856 4561361 1925173 474639 4713416 ...
$ pop_1962 : num [1:142] 11000948 4826015 2151895 512764 4919632 ...
$ pop_1967 : num [1:142] 12760499 5247469 2427334 553541 5127935 ...
$ pop_1972 : num [1:142] 14760787 5894858 2761407 619351 5433886 ...
$ pop_1977 : num [1:142] 17152804 6162675 3168267 781472 5889574 ...
$ pop_1982 : num [1:142] 20033753 7016384 3641603 970347 6634596 ...
$ pop_1987 : num [1:142] 23254956 7874230 4243788 1151184 7586551 ...
$ pop_1992 : num [1:142] 26298373 8735988 4981671 1342614 8878303 ...
$ pop_1997 : num [1:142] 29072015 9875024 6066080 1536536 10352843 ...
$ pop_2002 : num [1:142] 31287142 10866106 7026113 1630347 12251209 ...
$ pop_2007 : num [1:142] 33333216 12420476 8078314 1639131 14326203 ...R
all.equal(gap_wide, gap_wide_betterID)
出力
[1] "Attributes: < Component \"class\": Lengths (1, 3) differ (string compare on first 1) >"
[2] "Attributes: < Component \"class\": 1 string mismatch >" そこにまた戻りました!
その他役に立つ資料
- R for Data Science (online book)
- Data Wrangling Cheat sheet (pdf file)
- Introduction to tidyr (online documentation)
- Data wrangling with R and RStudio (online video)
- Use the
tidyrpackage to change the layout of data frames. - Use
pivot_longer()to go from wide to longer layout. - Use
pivot_wider()to go from long to wider layout.
Content from Producing Reports With knitr
最終更新日:2025-11-11 | ページの編集
概要
質問
- How can I integrate software and reports?
目的
- Understand the value of writing reproducible reports
- Learn how to recognise and compile the basic components of an R Markdown file
- Become familiar with R code chunks, and understand their purpose, structure and options
- Demonstrate the use of inline chunks for weaving R outputs into text blocks, for example when discussing the results of some calculations
- Be aware of alternative output formats to which an R Markdown file can be exported
データ分析報告
データ分析家は、協力者や、将来参照する文章として、分析及び結果を記した 報告を数多く書く傾向にあります。
Many new users begin by first writing a single R script containing all of their work, and then share the analysis by emailing the script and various graphs as attachments. But this can be cumbersome, requiring a lengthy discussion to explain which attachment was which result.
Writing formal reports with Word or LaTeX can simplify this process by incorporating both the analysis report and output graphs into a single document. But tweaking formatting to make figures look correct and fixing obnoxious page breaks can be tedious and lead to a lengthy “whack-a-mole” game of fixing new mistakes resulting from a single formatting change.
Creating a report as a web page (which is an html file) using R Markdown makes things easier. The report can be one long stream, so tall figures that wouldn’t ordinarily fit on one page can be kept at full size and easier to read, since the reader can simply keep scrolling. Additionally, the formatting of and R Markdown document is simple and easy to modify, allowing you to spend more time on your analyses instead of writing reports.
読み書きできるプログラミング
分析報告書のようなものは、再現できる 文書であることが理想です。つまり、 エラーが見つかった場合や、データに追加があった場合など、単に報告書を 再コンパイルすることで、新しい、または正しい結果が得られるという形です (再現できない文書の場合、図を再作成し、Word文書に貼り付け、更に手作業で 様々な詳細結果に手を加えなえればなりません)。
The key R package here is knitr. It allows you
to create a document that is a mixture of text and chunks of code.
文書がknitrで処理される際にRコードが実行され、
グラフや他の結果が文書に挿入されます。
こういうものを「読み書きできるプログラミング(literate programming)」と呼びます。
knitr allows you to mix basically any type of text with
code from different programming languages, but we recommend that you use
R Markdown, which mixes Markdown with R. Markdown is a light-weight
mark-up language for creating web pages.
R Markdownファイルの作成
R Studioで、File New File R Markdown をクリックしましょう。 すると、次のようなダイアログボックスが出ます:
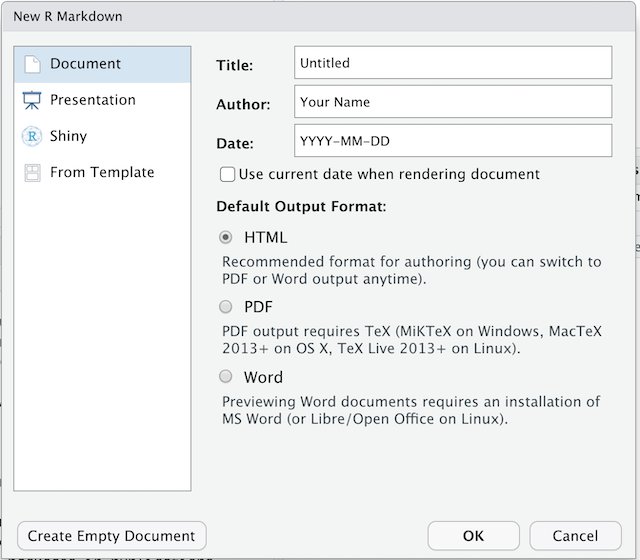
デフォルト(HTML output)のままでよいので、タイトルを付けましょう。
R Markdownの基本構成要素
The initial chunk of text (header) contains instructions for R to specify what kind of document will be created, and the options chosen. You can use the header to give your document a title, author, date, and tell it what type of output you want to produce. In this case, we’re creating an html document.
---
title: "Initial R Markdown document"
author: "Karl Broman"
date: "April 23, 2015"
output: html_document
---入れたくなければ、これらのフィールドのいずれも消すことができます。 二重引用符は、厳密には 必須 ではありません。 大抵は、タイトルにコロンを含めたいときに使います。
RStudioは、始めやすいように、例がいくつか入れられてある文書を作成します。 以下のような「チャンク(chunk)」がすでにあるかと思います:
``{r}
summary(cars)
```
これらはRコードの「チャンク」(塊)で、knitrによってコードが実行され、結果に置き換えられます。 また後ほど、詳しくお伝えします。
Markdown
Markdown is a system for writing web pages by marking up the text much as you would in an email rather than writing html code. The marked-up text gets converted to html, replacing the marks with the proper html code.
とりあえず、ここにあるものを全部消して、少しMarkdownを書いてみましょう。
二重アスタリスクを使って、 太字 に(例 bold)、
下線を使って、 斜体 にすることができます(例
_italics_)。
You can make a bulleted list by writing a list with hyphens or asterisks with a space between the list and other text, like this:
太字は、二重アスタリスクで 斜体は、下線で コードタイプのフォントは括弧でまたは、このように:
太字は、二重アスタリスクで - 斜体は、下線で - コードタイプのフォントは括弧でそれぞれ、以下の形で表示されます:
- 太字は、二重アスタリスクで
- 斜体は、下線で
- コードタイプのフォントは括弧で
You can use whatever method you prefer, but be consistent. This maintains the readability of your code.
数字を使って番号付きリストを作ることもできます。 同じ番号を何度でも好きなだけ使えます:
1. 太字は、二重アスタリスクで 1. 斜体は、下線で 1. コードタイプのフォントは括弧でこれは、次のように表示されます:
- 太字は、二重アスタリスクで
- 斜体は、下線で
- コードタイプのフォントは括弧で
行の頭に #
印を好きな数つけることで、色々なサイズの文節の題名を作ることができます:
# タイトル ## 主文節 ### 副文節 #### 更なる副文節You compile the R Markdown document to an html webpage by clicking the “Knit” button in the upper-left.
チャレンジ1
Create a new R Markdown document. Delete all of the R code chunks and write a bit of Markdown (some sections, some italicized text, and an itemized list).
Convert the document to a webpage.
In RStudio, select File > New file > R Markdown…
Delete the placeholder text and add the following:
# Introduction
## Background on Data
This report uses the *gapminder* dataset, which has columns that include:
* country
* continent
* year
* lifeExp
* pop
* gdpPercap
## Background on Methods
Then click the ‘Knit’ button on the toolbar to generate an html document (webpage).
もうちょっとMarkdownについて
次のような、ハイパーリンクを作ることができます:
[表示するテキスト](https://carpentries.org/).
You can include an image file like this:

下付き文字 (例 F2)は F~2 で、上付き文字(例
F2)は F^2^ でできます。
LaTeXの等式の書き方を知っていれば、
$ $ と $$ $$ で数式を挿入することができます。
例えば、 $E = mc^2$ や、
$$y = \mu + \sum_{i=1}^p \beta_i x_i + \epsilon$$You can review Markdown syntax by navigating to the “Markdown Quick Reference” under the “Help” field in the toolbar at the top of RStudio.
Rコードの「チャンク(塊)」
The real power of Markdown comes from mixing markdown with chunks of code. This is R Markdown. When processed, the R code will be executed; if they produce figures, the figures will be inserted in the final document.
メインのコードチャンクは、こんな感じです:
``{r load_data}
gapminder
That is, you place a chunk of R code between ```{r
chunk_name} and ```.
そうすると、エラーを修正するときに役立ちますし、グラフのファイル名は、生成されたコードのチャンクの名前に基づいて付けられるからです。
You can create code chunks quickly in RStudio using the shortcuts
Ctrl+Alt+I on Windows and Linux, or
Cmd+Option+I on Mac.
チャレンジ
チャレンジ2
Add code chunks to:
- Load the ggplot2 package
- Read the gapminder data
- Create a plot
``{r load-ggplot2}
library("ggplot2")
```
``{r read-gapminder-data}
gapminder
``{r make-plot}
plot(lifeExp ~ year, data = gapminder)
```
どうコンパイルされるか
「Knit HTML」ボタンを押すと、R Markdown文書はknitr によって処理され、単純なMarkdown文書が(一連の図のファイルと共に)生成されます。 Rコードは実行され、入力と出力に置き換えられます。図が生成された場合、 これらの図へのリンクが挿入されます。
Markdownと図の文書は、pandoc というツールで処理され、 Markdownファイルは、図の埋め込まれたhtmlファイルに変換されます。
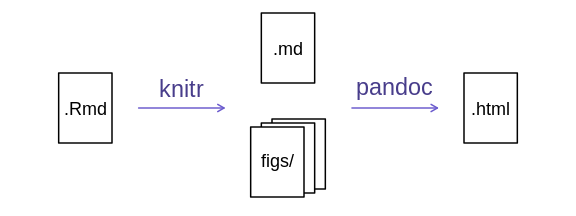
チャンクのオプション
コードのチャンクがどう扱われるかは、様々なオプションによって決められます。 Here are some examples:
- コード自体を見せないためには、
echo=FALSEを使います
- コード自体を見せないためには、
- 結果を表示しないためには、
results="hide"を使います
- 結果を表示しないためには、
- コードを演算せず表示するためには、
eval=FALSEを使います
- コードを演算せず表示するためには、
- 警告やメッセージを隠す場合は、
warning=FALSEとmessage=FALSEを使います
- 警告やメッセージを隠す場合は、
- 生成される図の大きさを(インチで)管理するためには、
fig.heightとfig.widthを使います
- 生成される図の大きさを(インチで)管理するためには、
なので、書くとすれば:
``{r load_libraries, echo=FALSE, message=FALSE}
library("dplyr")
library("ggplot2")
```
使いたいオプションを別のチャンクでも使いたい場合は、 global_options を使います。例えば:
``{r global_options, echo=FALSE}
knitr::opts_chunk$set(fig.path="Figs/", message=FALSE, warning=FALSE,
echo=FALSE, results="hide", fig.width=11)
```
fig.path
オプションは、図のファイルがどこに保存されるかを定義します。 ここでの
/ はとても重要で、もしこれがなければ、図は標準的な場所に
保存されますが、 Figs
で始まる名前のファイルだけになります。
共有ディレクトリにR Markdownファイルが複数ある場合は、
fig.path
を図のファイル名と異なる接頭語を付けるために使うといいかもしれません。
例えば、fig.path="Figs/cleaning-" と
fig.path="Figs/analysis-" とすれば、 それぞれ
"cleaning-" と "analysis-"
で始まる図のファイルが "Figs/"
ディレクトリに保存されます。
チャレンジ3
図の大きさを管理し、コードを隠すチャンクのオプションを使ってみましょう。
``{r echo = FALSE, fig.width = 3}
plot(faithful)
```
You can review all of the R chunk options by navigating
to the “R Markdown Cheat Sheet” under the “Cheatsheets” section of the
“Help” field in the toolbar at the top of RStudio.
文中のRコード
報告書にある、全て
の数を再現可能なものにすることができます。 インラインコードチャンクには
`r と `
で囲んで、例えばこのように記述します:r round(some_value,
2)。 このコードはコンパイル時に実行され、結果の 値
に置き換えられます。
この文中のチャンクを、複数の行に分けて入れないようにしましょう。
こういう場合は、パラグラフの前にinclude=FALSE (
echo=FALSE と results="hide"
の組み合わせと同じ)のオプションを設定した、
定義や演算を行うコードチャンクを作っておきましょう。
Rounding can produce differences in output in such situations.
2.0 が欲しくても、round(2.03, 1) ではただの
2 が出てきてしまいます。
R/bromanパッケージにある、
myround関数が、
この問題に対処してくれます。
チャレンジ4
文中のRコードを少し試してみましょう。
Here’s some inline code to determine that 2 + 2 = 4.
その他の出力オプション
R MarkdownをPDFやWord文書に変換することもできます。
ドロップダウンメニューを表示させるために、「Knit
HTML」の横にある小さい三角をクリックしましょう。 または、
pdf_document や word_document
をファイルの最初のヘッダー(header)に入れておくこともできます。
ヒント:PDFドキュメントの作成
.pdf
文書を作成するためには、いくつかソフトウェアをインストールしなければいけないかもしれません。
The R package tinytex provides some tools to help make this
process easier for R users. With tinytex installed, run
tinytex::install_tinytex() to install the required software
(you’ll only need to do this once) and then when you knit to pdf
tinytex will automatically detect and install any
additional LaTeX packages that are needed to produce the pdf document.
Visit the tinytex website for
more information.
Tip: Visual markdown editing in RStudio
RStudio versions 1.4 and later include visual markdown editing mode.
In visual editing mode, markdown expressions (like
**bold words**) are transformed to the formatted appearance
(bold words) as you type. This mode also includes a
toolbar at the top with basic formatting buttons, similar to what you
might see in common word processing software programs. You can turn
visual editing on and off by pressing the ![]() button in the top right corner of your R Markdown document.
button in the top right corner of your R Markdown document.
資料
- Knitr in a knutshell tutorial
- Dynamic Documents with R and knitr (book)
- R Markdown documentation
- R Markdown cheat sheet
- Getting started with R Markdown
- R Markdown: The Definitive Guide (book by Rstudio team)
- Reproducible Reporting
- The Ecosystem of R Markdown
- Introducing Bookdown
- Mix reporting written in R Markdown with software written in R.
- Specify chunk options to control formatting.
- Use
knitrto convert these documents into PDF and other formats.
Content from Writing Good Software
最終更新日:2025-11-11 | ページの編集
概要
質問
- How can I write software that other people can use?
目的
- Describe best practices for writing R and explain the justification for each.
プロジェクトフォルダーを構造化する
Keep your project folder structured, organized and tidy, by creating
subfolders for your code files, manuals, data, binaries, output plots,
etc. It can be done completely manually, or with the help of RStudio’s
New Project functionality, or a designated package, such as
ProjectTemplate.
ヒント:解決策の一つ:ProjectTemplate
One way to automate the management of projects is to install the
third-party package, ProjectTemplate. This package will set
up an ideal directory structure for project management. This is very
useful as it enables you to have your analysis pipeline/workflow
organised and structured. Together with the default RStudio project
functionality and Git you will be able to keep track of your work as
well as be able to share your work with collaborators.
- Install
ProjectTemplate. - Load the library
- Initialise the project:
R
install.packages("ProjectTemplate")
library("ProjectTemplate")
create.project("../my_project_2", merge.strategy = "allow.non.conflict")
For more information on ProjectTemplate and its functionality visit the home page ProjectTemplate
コードを読めるようにする
The most important part of writing code is making it readable and understandable. コードを書く際に一番重要なのが、読みやすくて理解のしやすくすることです。 他の誰が自分のコードを取り上げ、何をするものかを理解してもらわなければなりません。 多くの場合、この誰かさんは、6か月後の自分なので、もしコードが読めない、 理解できない場合は、昔の自分に悪態をつくことになるでしょう。
文書化:「どうやって」ではなく「なぜ」を伝えて下さい
When you first start out, your comments will often describe what a command does, since you’re still learning yourself and it can help to clarify concepts and remind you later. However, these comments aren’t particularly useful later on when you don’t remember what problem your code is trying to solve. Try to also include comments that tell you why you’re solving a problem, and what problem that is. The how can come after that: it’s an implementation detail you ideally shouldn’t have to worry about.
コードをモジュール化しましょう
関数を分析スクリプトと分けて、別のファイルに保存しておき、
プロジェクトでRのセッションを開いたときに、 source
することをオススメします。
このアプローチを取ると、分析スクリプトに無駄がなくなり、プロジェクト内のどの分析スクリプトでも
使える関数をストックする場所ができるので、便利です。
また、同じような関数をまとめるのが簡単になります。
問題をひとくち大に分ける
初めは、問題解決と関数の記述は気が滅入るタスクで、 コードの経験不足とは別の問題として分けることができないと思うかもしれません。問題を消化できる塊に分け、 導入の詳細についての心配は後回しにしましょう: 問題をコードで解決できるまで、どんどん小さい関数に分けていきしましょう。 そして、解決されたものを積み上げていけば、問題を解決できるでしょう。
コードが正しいことをしているか確かめましょう
関数をテストすることを、くれぐれも忘れないように!
同じことを繰り返さないようにしましょう
Functions enable easy reuse within a project. 関数は、プロジェクトの中で簡単に再利用できます。もし、プロジェクトで同じようなコードの行の塊を 見つけたら、それらを関数に移す候補にしましょう。
もし、計算が一連の関数で行われていた場合、プロジェクトはよりモジュール化され、変更するのが簡単になります。 これは、特定のインプットが必ず特定のアウトプットを返す場合など、特にそうです。
常にスタイリッシュであろうとする
自分のコードに一貫性のあるスタイルを適用しましょう。
- Keep your project folder structured, organized and tidy.
- Document what and why, not how.
- Break programs into short single-purpose functions.
- Write re-runnable tests.
- 同じことを繰り返さないようにしましょう.
- Be consistent in naming, indentation, and other aspects of style.
