Creating Publication-Quality Graphics with ggplot2
最終更新日:2025-11-11 | ページの編集
概要
質問
- How can I create publication-quality graphics in R?
目的
- To be able to use ggplot2 to generate publication-quality graphics.
- To apply geometry, aesthetic, and statistics layers to a ggplot plot.
- To manipulate the aesthetics of a plot using different colors, shapes, and lines.
- To improve data visualization through transforming scales and paneling by group.
- To save a plot created with ggplot to disk.
データをプロットすることは、データとその変数間の様々な関係をクイックに探索する最良の方法の一つです。
Rには、主に3つのプロットシステムがあります。 R組み込みplot関数、 lattice パッケージ、ggplot2 パッケージです。
今回、私たちはggplot2パッケージについて学んでいきます。 なぜなら、ggplot2パッケージは出版品質並のグラフィック作成に最も効果的だからです。
ggplot2 is built on the grammar of graphics, the idea that any plot can be built from the same set of components: a data set, mapping aesthetics, and graphical layers:
Data sets are the data that you, the user, provide.
Mapping aesthetics are what connect the data to the graphics. They tell ggplot2 how to use your data to affect how the graph looks, such as changing what is plotted on the X or Y axis, or the size or color of different data points.
Layers are the actual graphical output from ggplot2. Layers determine what kinds of plot are shown (scatterplot, histogram, etc.), the coordinate system used (rectangular, polar, others), and other important aspects of the plot. このアイディアは、Photoshop、Illustrator、Inkscapeなどの画像編集ソフトを使用する場面でお馴染みかもしれません。
Let’s start off building an example using the gapminder data from
earlier. The most basic function is ggplot, which lets R
know that we’re creating a new plot. Any of the arguments we give the
ggplot function are the global options for the
plot: they apply to all layers on the plot.
R
library("ggplot2")
ggplot(data = gapminder)

Here we called ggplot and told it what data we want to
show on our figure. This is not enough information for
ggplot to actually draw anything. It only creates a blank
slate for other elements to be added to.
Now we’re going to add in the mapping aesthetics
using the aes function. aes tells
ggplot how variables in the data map to
aesthetic properties of the figure, such as which columns of
the data should be used for the x and
y locations.
R
ggplot(data = gapminder, mapping = aes(x = gdpPercap, y = lifeExp))
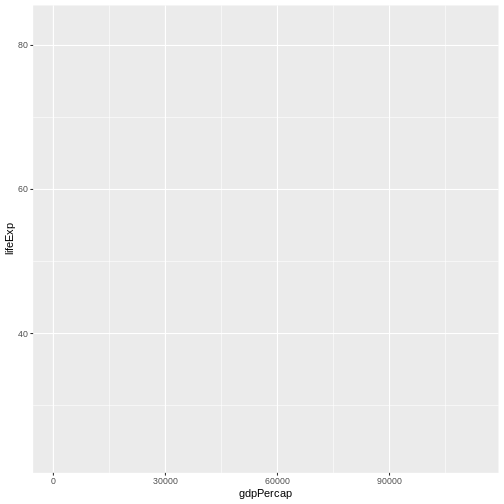
Here we told ggplot we want to plot the “gdpPercap”
column of the gapminder data frame on the x-axis, and the “lifeExp”
column on the y-axis. Notice that we didn’t need to explicitly pass
aes these columns
(e.g. x = gapminder[, "gdpPercap"]), this is because
ggplot is smart enough to know to look in the
data for that column!
The final part of making our plot is to tell ggplot how
we want to visually represent the data. We do this by adding a new
layer to the plot using one of the
geom functions.
R
ggplot(data = gapminder, mapping = aes(x = gdpPercap, y = lifeExp)) +
  geom_point()
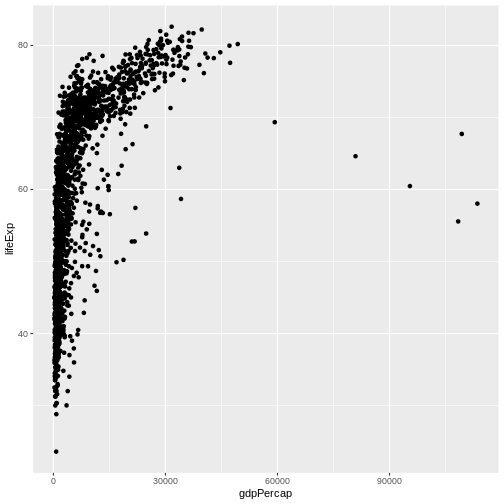
Here we used geom_point, which tells ggplot
we want to visually represent the relationship between
x and y as a scatterplot of
points.
チャレンジ1
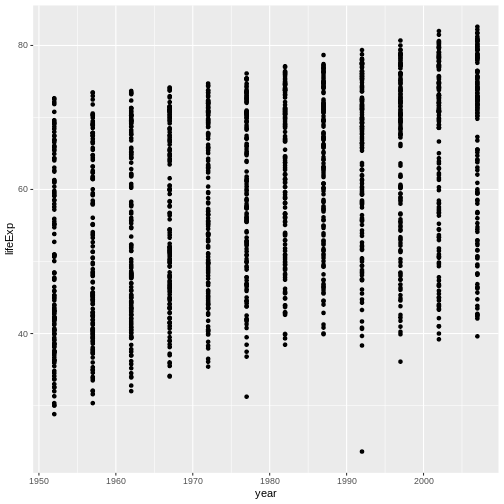
Modify the example so that the figure shows how life expectancy has changed over time:
R
ggplot(data = gapminder, mapping = aes(x = gdpPercap, y = lifeExp)) + geom_point()
Hint: the gapminder dataset has a column called “year”, which should appear on the x-axis.
Here is one possible solution:
R
ggplot(data = gapminder, mapping = aes(x = year, y = lifeExp)) + geom_point()
チャレンジ2
チャレンジ 2 先の例題とチャレンジでは、aes
関数を使用して、各点の x と y の位置について散布図 geom を指定しました。
修正できるもう1つのエステティック属性は、点の色です。
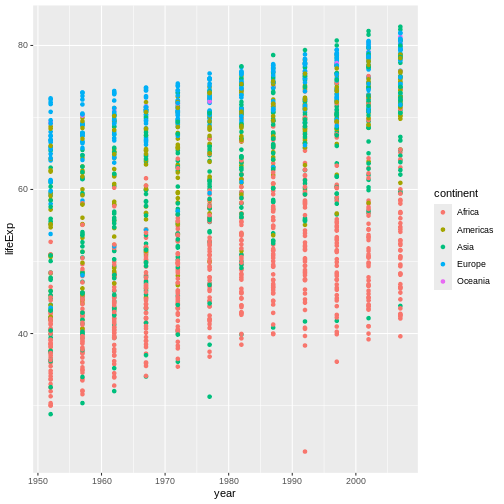
先のチャレンジのコードを修正して、“continent” 列で点に色付けして下さい。
データにどはどのような傾向が見られますか?
それらの傾向は、あなたが期待したものですか?
The solution presented below adds color=continent to the
call of the aes function. The general trend seems to
indicate an increased life expectancy over the years. On continents with
stronger economies we find a longer life expectancy.
R
ggplot(data = gapminder, mapping = aes(x = year, y = lifeExp, color=continent)) +
  geom_point()
レイヤー
散布図を使用することは、時間経過による変化を視覚化するのに、おそらく最適ではありません。 代わりに、データを線グラフとして可視化するようggplotに指示しましょう。
R
ggplot(data = gapminder, mapping = aes(x=year, y=lifeExp, color=continent)) +
  geom_line()
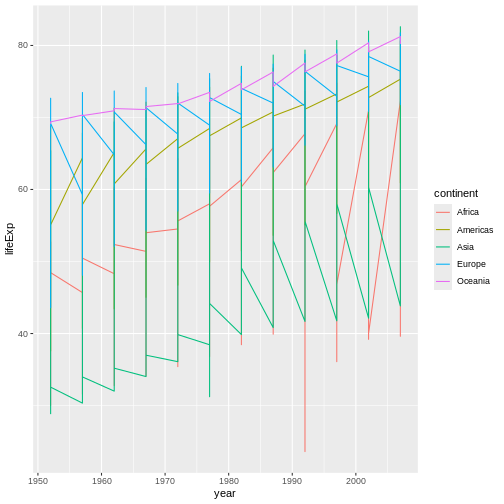
geom_pointレイヤーを追加する代わりに、geom_lineレイヤーを追加しました。
However, the result doesn’t look quite as we might have expected: it seems to be jumping around a lot in each continent. Let’s try to separate the data by country, plotting one line for each country:
R
ggplot(data = gapminder, mapping = aes(x=year, y=lifeExp, group=country, color=continent)) +
  geom_line()
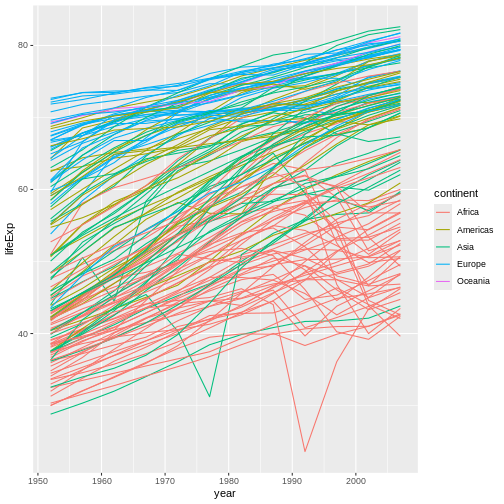
by
エステティックを追加し、各国ごとに線を描くようggplotに指示します。
しかし、線と点の両方をプロット上に視覚化したい場合はどうすればよいでしょうか? プロットに別のレイヤーを追加するだけです。
R
ggplot(data = gapminder, mapping = aes(x=year, y=lifeExp, group=country, color=continent)) +
  geom_line() + geom_point()
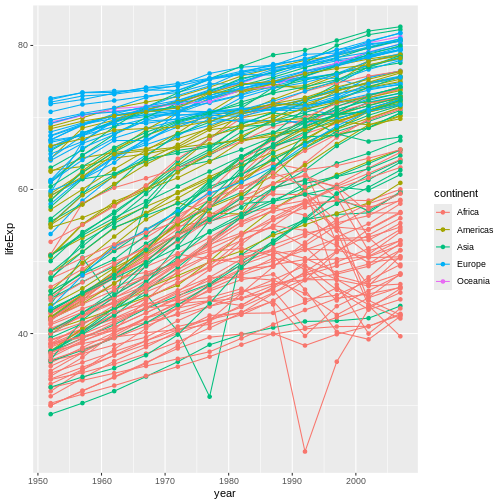
It’s important to note that each layer is drawn on top of the previous layer. In this example, the points have been drawn on top of the lines. Here’s a demonstration:
R
ggplot(data = gapminder, mapping = aes(x=year, y=lifeExp, group=country)) +
  geom_line(mapping = aes(color=continent)) + geom_point()
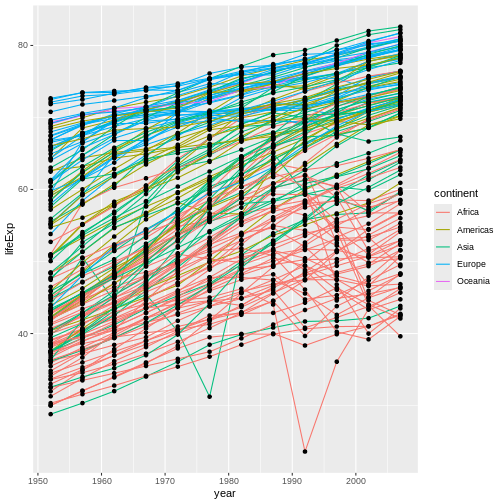
この例では、 color
エステティックマッピングが、ggplotのグローバルプロットオプションからgeom_lineレイヤーに移動されたため、
点には色が適用されなくなりました。
これで、点が線の上に描画されていることがわかります。
ヒント:エステティック属性に、マッピングの代わりに値を設定する
So far, we’ve seen how to use an aesthetic (such as
color) as a mapping to a variable in the data.
For example, when we use
geom_line(mapping = aes(color=continent)), ggplot will give
a different color to each continent. But what if we want to change the
color of all lines to blue? You may think that
geom_line(mapping = aes(color="blue")) should work, but it
doesn’t. Since we don’t want to create a mapping to a specific variable,
we can move the color specification outside of the aes()
function, like this: geom_line(color="blue").
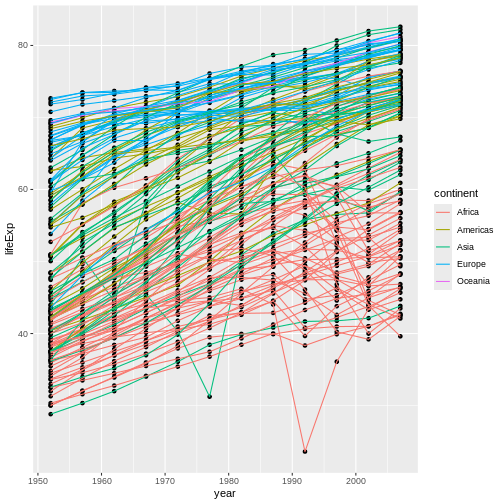
チャレンジ3
Switch the order of the point and line layers from the previous example. 何が起こったのでしょう?Rは、csvファイルを読み込む際、 列にある全てのものが同じ基本の型であるべきだと主張します。もし、列の 全て が、 double型であることが確認できない場合、その列の だれも double型にならないのです。
The lines now get drawn over the points!
R
ggplot(data = gapminder, mapping = aes(x=year, y=lifeExp, group=country)) +
 geom_point() + geom_line(mapping = aes(color=continent))
変換と統計
ggplot2を使用すると、統計モデルをデータに適用することが容易になります。 デモのために、最初の例に戻ります。
R
ggplot(data = gapminder, mapping = aes(x = gdpPercap, y = lifeExp)) +
  geom_point()
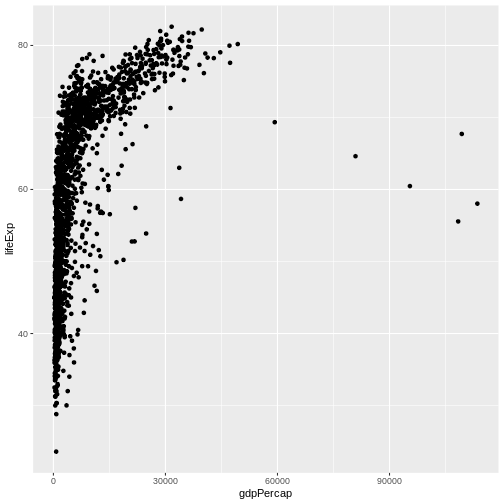
Currently it’s hard to see the relationship between the points due to some strong outliers in GDP per capita. We can change the scale of units on the x axis using the scale functions. These control the mapping between the data values and visual values of an aesthetic. We can also modify the transparency of the points, using the alpha function, which is especially helpful when you have a large amount of data which is very clustered.
R
ggplot(data = gapminder, mapping = aes(x = gdpPercap, y = lifeExp)) +
  geom_point(alpha = 0.5) + scale_x_log10()
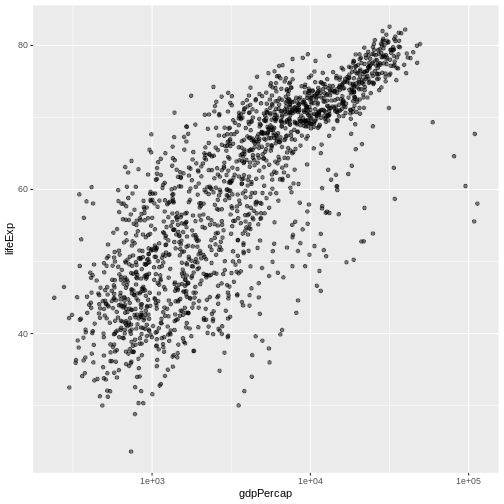
The scale_x_log10 function applied a transformation to
the coordinate system of the plot, so that each multiple of 10 is evenly
spaced from left to right. For example, a GDP per capita of 1,000 is the
same horizontal distance away from a value of 10,000 as the 10,000 value
is from 100,000. This helps to visualize the spread of the data along
the x-axis.
ヒントのリマインダ:エステティック属性に、マッピングの代わりに値を設定する
geom_point(alpha = 0.5)を使用したことに注目してください。
先のヒントで触れたように、aes()関数以外の設定を使用すると、この値がすべての点で使用されます。
この場合、この値が必要です。しかし、他のエステティック設定と同様に、
alpha はデータ内の変数にマッピングすることもできます。
たとえば、geom_point(aes(alpha = continent))を使用して、各大陸に異なる透明度を与えることができます。
geom_smoothという別のレイヤーを追加することで、データに単純な関係を当てはめることができます。
R
ggplot(data = gapminder, mapping = aes(x = gdpPercap, y = lifeExp)) +
  geom_point(alpha = 0.5) + scale_x_log10() + geom_smooth(method="lm")
出力
`geom_smooth()` using formula = 'y ~ x'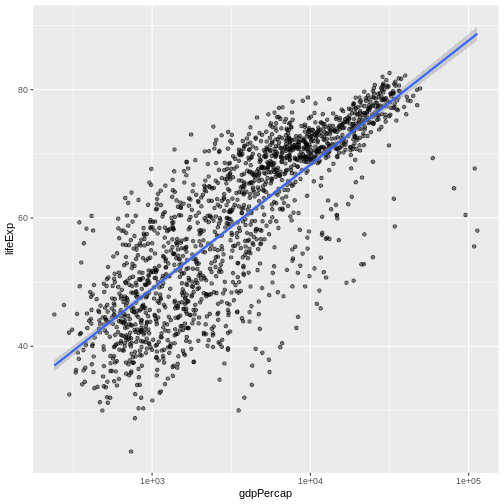
geom_smoothレイヤーで size
エステティック属性を設定することによって、
線を太くすることができます。
R
ggplot(data = gapminder, mapping = aes(x = gdpPercap, y = lifeExp)) +
  geom_point(alpha = 0.5) + scale_x_log10() + geom_smooth(method="lm", linewidth=1.5)
出力
`geom_smooth()` using formula = 'y ~ x'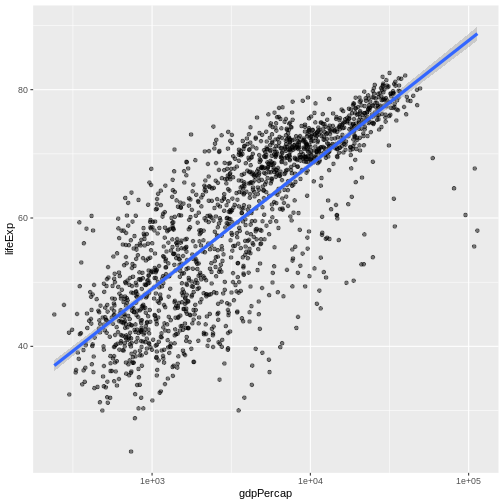
エステティック属性を指定する方法は2つあります。 Here we set
the linewidth aesthetic by passing it as an argument to
geom_smooth and it is applied the same to the whole
geom.
これまでのレッスンでは、データの変数とその視覚表現の間のマッピングを定義するためにaes関数を使用しました。
チャレンジ 4a
前の例を用いて、点レイヤー上の点の色とサイズを変更して下さい。
ヒント:’aes’関数を使用しないでください。
Hint: the equivalent of linewidth for points is
size.
Here a possible solution: Notice that the color argument
is supplied outside of the aes() function. This means that
it applies to all data points on the graph and is not related to a
specific variable.
R
ggplot(data = gapminder, mapping = aes(x = gdpPercap, y = lifeExp)) +
 geom_point(size=3, color="orange") + scale_x_log10() +
 geom_smooth(method="lm", linewidth=1.5)
出力
`geom_smooth()` using formula = 'y ~ x'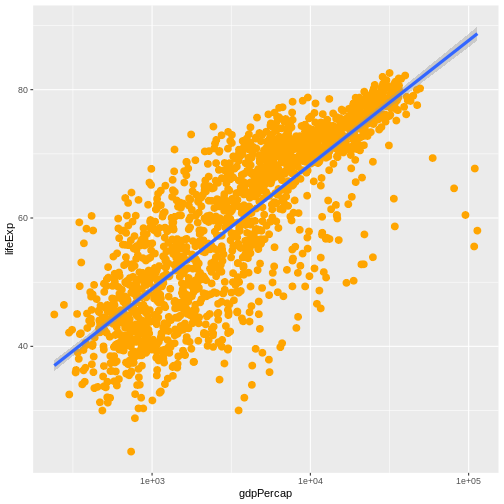
チャレンジ 4b
点を異なる形にし、また大陸毎に色分けと傾向線の描画をするために、 チャレンジ4aの回答を変更して下さい。 ヒント:color引数は、aes関数内で使用することができます。
Here is a possible solution: Notice that supplying the
color argument inside the aes() functions
enables you to connect it to a certain variable. The shape
argument, as you can see, modifies all data points the same way (it is
outside the aes() call) while the color
argument which is placed inside the aes() call modifies a
point’s color based on its continent value.
R
ggplot(data = gapminder, mapping = aes(x = gdpPercap, y = lifeExp, color = continent)) +
 geom_point(size=3, shape=17) + scale_x_log10() +
 geom_smooth(method="lm", linewidth=1.5)
出力
`geom_smooth()` using formula = 'y ~ x'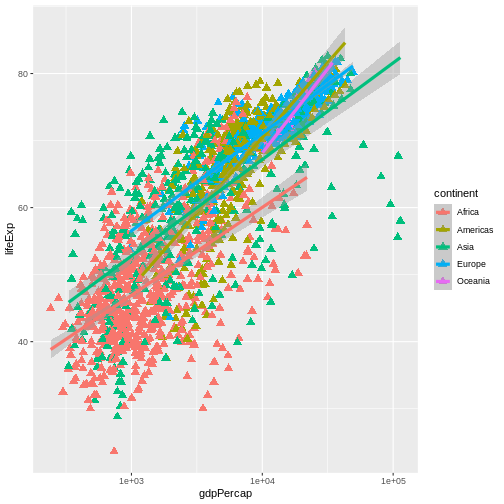
複数パネルの図
先の例では、すべての国の平均余命の変化を1つのプロットで視覚化しました。 一方、 facet パネルのレイヤーを追加することで、複数のパネルに分割することができます。
ヒント
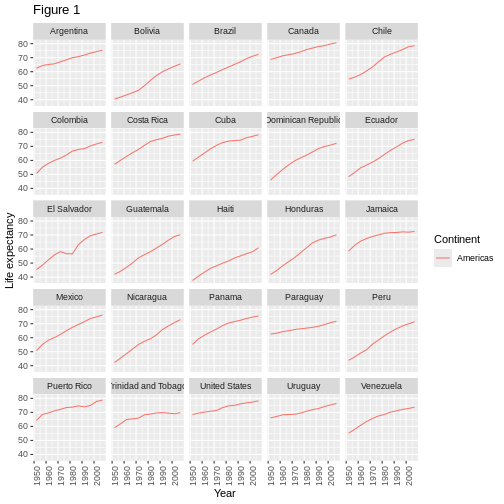
We start by making a subset of data including only countries located in the Americas. This includes 25 countries, which will begin to clutter the figure. Note that we apply a “theme” definition to rotate the x-axis labels to maintain readability. Nearly everything in ggplot2 is customizable.
R
americas <- gapminder[gapminder$continent == "Americas",]
ggplot(data = americas, mapping = aes(x = year, y = lifeExp)) +
  geom_line() +
  facet_wrap( ~ country) +
  theme(axis.text.x = element_text(angle = 45))
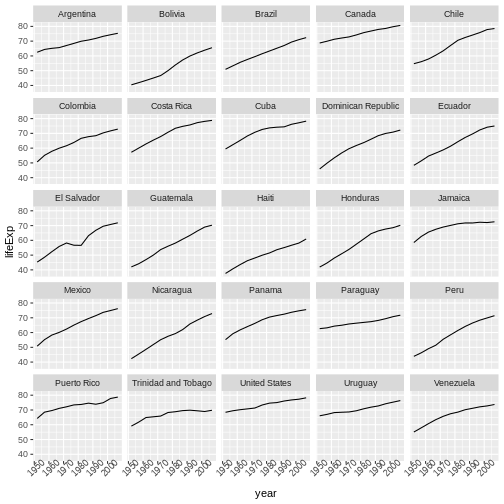
facet_wrapレイヤーは引数として“formula”をとり、チルダ(~)で表記されます。
これは、gapminderデータセットのcountry列にある各々の一意な値のパネルを描画するようRに指示します。
テキストの変更
分析結果の発表に向けてこの図を整理するにあたり、いくつかのテキスト要素を変更する必要があります。 x軸はあまりにも雑然としており、y軸はデータフレームの列名ではなく、“Life expectancy”と読み替えるべきです。
これを行うには、いくつかのレイヤーを追加する必要があります。 theme
レイヤーは、軸テキストと全体のテキストサイズを制御します。
軸、プロットタイトル、および任意の凡例のラベルは、labs関数を使用して設定できます。
凡例のタイトルは、aes関数で使用したものと同じ名前を設定します。
したがって、color凡例のタイトルはcolor = "Continent"を用いて設定され、
fill凡例のタイトルはfill = "任意のタイトル"を使用して設定されます。
R
ggplot(data = americas, mapping = aes(x = year, y = lifeExp, color=continent)) +
  geom_line() + facet_wrap( ~ country) +
  labs(
    x = "Year",              # x axis title
    y = "Life expectancy",   # y axis title
    title = "Figure 1",      # main title of figure
    color = "Continent"      # title of legend
  ) +
  theme(axis.text.x = element_text(angle = 90, hjust = 1))
プロットのエクスポート
ggsave()関数を使用すると、ggplotで作成したプロットをエクスポートすることができます。
出版、公開のための高品質グラフィックを作成するために、
適切な引数(width、height、およびdpi)を調整してプロットの寸法と解像度を指定できます。
上記のように、そのプロットを保存するには、最初にそのプロットを変数lifeExp_plotに割り当て、
ggsaveにそのプロットをpng形式でresultsというディレクトリに保存するよう指示します。
(作業ディレクトリに’results
/’フォルダがあることを確認してください。)
R
lifeExp_plot <- ggplot(data = americas, mapping = aes(x = year, y = lifeExp, color=continent)) +
  geom_line() + facet_wrap( ~ country) +
  labs(
    x = "Year",              # x axis title
    y = "Life expectancy",   # y axis title
    title = "Figure 1",      # main title of figure
    color = "Continent"      # title of legend
  ) +
  theme(axis.text.x = element_text(angle = 90, hjust = 1))

ggsave(filename = "results/lifeExp.png", plot = lifeExp_plot, width = 12, height = 10, dpi = 300, units = "cm")
ggsaveには素晴らしい点が二つあります。
一つ目は、最後のプロットがデフォルトになるので、plot引数を省略すると、ggplotで作成した最後のプロットが自動的に保存されることです。
二つ目は、ファイル名に指定したファイル拡張子(例:.pngまたは.pdf)からプロットを保存するフォーマットを決定しようとします。
必要な場合は、device引数に明示的にフォーマットを指定できます。
This is a taste of what you can do with ggplot2. RStudio provides a really useful cheat sheet of the different layers available, and more extensive documentation is available on the ggplot2 website. All RStudio cheat sheets are available from the RStudio website. Finally, if you have no idea how to change something, a quick Google search will usually send you to a relevant question and answer on Stack Overflow with reusable code to modify!
チャレンジ5
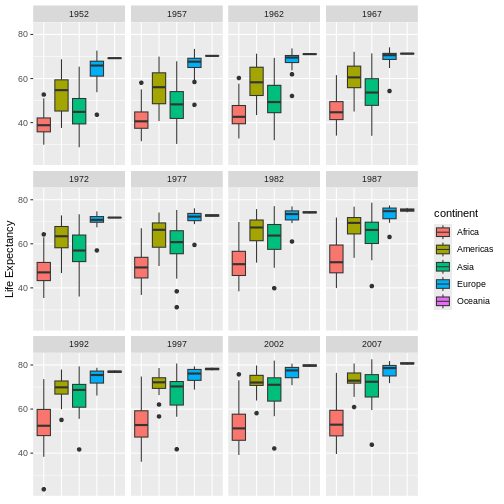
Generate boxplots to compare life expectancy between the different continents during the available years.
Advanced:
- Rename y axis as Life Expectancy.
- Remove x axis labels.
Here a possible solution: xlab() and ylab()
set labels for the x and y axes, respectively The axis title, text and
ticks are attributes of the theme and must be modified within a
theme() call.
R
ggplot(data = gapminder, mapping = aes(x = continent, y = lifeExp, fill = continent)) +
 geom_boxplot() + facet_wrap(~year) +
 ylab("Life Expectancy") +
 theme(axis.title.x=element_blank(),
       axis.text.x = element_blank(),
       axis.ticks.x = element_blank())
- Use
ggplot2to create plots. - Think about graphics in layers: aesthetics, geometry, statistics, scale transformation, and grouping.
