ベクトル化
最終更新日:2025-11-11 | ページの編集
概要
質問
- How can I operate on all the elements of a vector at once?
目的
- To understand vectorized operations in R.
Rの関数はほとんどがベクトル化されており、関数はベクトルの全ての要素を最初から操作してくれるので、ベクトルの要素ごとにいちいちループする必要がありません。 おかげで簡潔で読み易く、エラーの少ないコードを書くことができます。
R
x <- 1:4
x * 2
出力
[1] 2 4 6 8積はベクトルの要素ごとに実行されました。
2つのベクトルを足し合わせることもできます:
R
y <- 6:9
x + y
出力
[1] 7 9 11 13この場合 x の各要素が対応する
yの要素に足されます。
Here is how we would add two vectors together using a for loop:
R
output_vector <- c()
for (i in 1:4) {
  output_vector[i] <- x[i] + y[i]
}
output_vector
出力
[1] 7 9 11 13Compare this to the output using vectorised operations.
R
sum_xy <- x + y
sum_xy
出力
[1] 7 9 11 13チャレンジ1
gapminder データセットの pop
列でこれに挑戦してみましょう。
gapminder
データフレームに百万人単位の人口を示す列を追加しましょう。
データフレームの先頭か最後を確認して、追加に成功したか確認しましょう。
gapminder データセットの pop
列でこれに挑戦してみましょう。
gapminder
データフレームに百万人単位の人口を示す列を追加しましょう。
データフレームの先頭か最後を確認して、追加に成功したか確認しましょう。
R
gapminder$pop_millions <- gapminder$pop / 1e6
head(gapminder)
出力
      country year      pop continent lifeExp gdpPercap pop_millions
1 Afghanistan 1952  8425333      Asia  28.801  779.4453     8.425333
2 Afghanistan 1957  9240934      Asia  30.332  820.8530     9.240934
3 Afghanistan 1962 10267083      Asia  31.997  853.1007    10.267083
4 Afghanistan 1967 11537966      Asia  34.020  836.1971    11.537966
5 Afghanistan 1972 13079460      Asia  36.088  739.9811    13.079460
6 Afghanistan 1977 14880372 Asia 38.438 786.1134 14.880372チャレンジ2
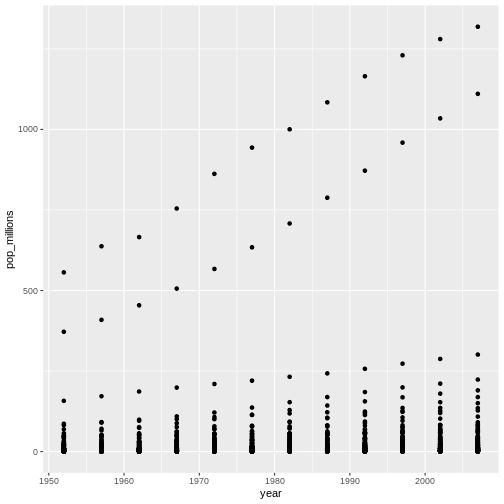
一つの図に、100万人単位の人口を年ごとにプロットしてみましょう。 国ごとの区別はつかなくていいです。
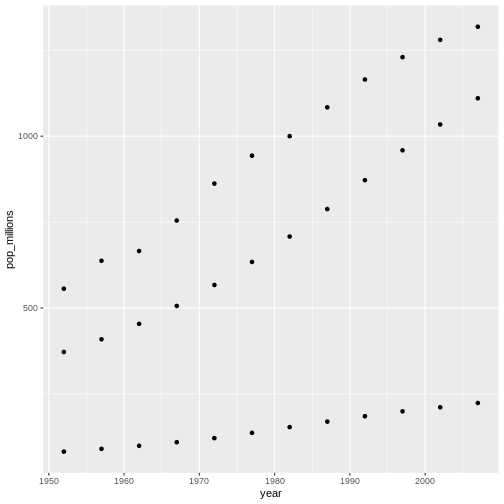
練習を繰り返して、中国とインドとインドネシアだけを含む図を 作ってみましょう。 先程と同じく、国ごとの区別はつかなくていいです。
チャレンジの解答 100万人単位の人口を年ごとにプロットして、作図方法を復習しましょう。
R
ggplot(gapminder, aes(x = year, y = pop_millions)) +
 geom_point()

R
countryset <- c("China","India","Indonesia")
ggplot(gapminder[gapminder$country %in% countryset,],
       aes(x = year, y = pop_millions)) +
  geom_point()

比較演算子や論理演算子に加え、多くの関数もベクトル化されています。
比較演算子
R
x > 2
出力
[1] FALSE FALSE TRUE TRUE論理演算子
エラー
Error in parse(text = input): <text>:1:8: unexpected numeric constant
1: a <- x 3
^Tip: 論理ベクトルに使える便利な関数
-
any()はベクトルの要素の中に一つでもTRUEがあればTRUEを返します。 -
all()はベクトルの要素が 全てTRUEであればTRUEを返します。
ほとんどの関数はベクトルを要素ごとに処理します。
関数
R
x <- 1:4
log(x)
出力
[1] 0.0000000 0.6931472 1.0986123 1.3862944ベクトル化された操作は行列を要素ごとに処理します:
R
m <- matrix(1:12, nrow=3, ncol=4)
m * -1
出力
     [,1] [,2] [,3] [,4]
[1,]   -1   -4   -7  -10
[2,]   -2   -5   -8  -11
[3,] -3 -6 -9 -12Tip: 要素ごとの積 vs. 行列の積
非常に重要: 演算子は要素ごとの積を行います! To do
matrix multiplication, we need to use the %*% operator:
R
m %*% matrix(1, nrow=4, ncol=1)
出力
     [,1]
[1,]   22
[2,]   26
[3,]   30
R
matrix(1:4, nrow=1) %*% matrix(1:4, ncol=1)
出力
     [,1]
[1,]   30
更に行列代数について知るには Quick-R reference guide を参照して下さい
チャレンジ3
以下のリストがあるとします:
R
m <- matrix(1:12, nrow=3, ncol=4)
m
出力
     [,1] [,2] [,3] [,4]
[1,]    1    4    7   10
[2,]    2    5    8   11
[3,]    3    6    9   12
Write down what you think will happen when you run:
m ^ -1m * c(1, 0, -1)m > c(0, 20)m * c(1, 0, -1, 2)
Did you get the output you expected? If not, ask a helper!
以下のリストがあるとします:
R
m <- matrix(1:12, nrow=3, ncol=4)
m
出力
     [,1] [,2] [,3] [,4]
[1,]    1    4    7   10
[2,]    2    5    8   11
[3,]    3    6    9   12
Write down what you think will happen when you run:
m ^ -1
出力
          [,1]      [,2]      [,3]       [,4]
[1,] 1.0000000 0.2500000 0.1428571 0.10000000
[2,] 0.5000000 0.2000000 0.1250000 0.09090909
[3,] 0.3333333 0.1666667 0.1111111 0.08333333
m * c(1, 0, -1)
出力
     [,1] [,2] [,3] [,4]
[1,]    1    4    7   10
[2,]    0    0    0    0
[3,]   -3   -6   -9  -12
m > c(0, 20)
出力
      [,1]  [,2]  [,3]  [,4]
[1,]  TRUE FALSE  TRUE FALSE
[2,] FALSE  TRUE FALSE  TRUE
[3,] TRUE FALSE TRUE FALSEチャレンジ4
以下の分数の数列の総和が知りたいとします: ~~~ x:
R
x = 1/(1^2) + 1/(2^2) + 1/(3^2) + ... + 1/(n^2)
- /(n^) ~~~ これをタイプするのは面倒な上に、nが大きいと不可能です。 ベクトル化を用いて n = 100 の場合を計算しましょう。 n = 10,000 の時の総和はいくつでしょうか?
以下の分数の数列の総和が知りたいとします: ~~~ x:
R
x = 1/(1^2) + 1/(2^2) + 1/(3^2) + ... + 1/(n^2)
- /(n^) ~~~ これをタイプするのは面倒な上に、nが大きいと不可能です。 ベクトル化を用いて n = 100 の場合を計算しましょう。 n = 10,000 の時の総和はいくつでしょうか?
R
sum(1/(1:100)^2)
出力
[1] 1.634984R
sum(1/(1:1e04)^2)
出力
[1] 1.644834R
n <- 10000
sum(1/(1:n)^2)
出力
[1] 1.644834We can also obtain the same results using a function:
R
inverse_sum_of_squares <- function(n) {
  sum(1/(1:n)^2)
}
inverse_sum_of_squares(100)
出力
[1] 1.634984R
inverse_sum_of_squares(10000)
出力
[1] 1.644834R
n <- 10000
inverse_sum_of_squares(n)
出力
[1] 1.644834Tip: Operations on vectors of unequal length
Operations can also be performed on vectors of unequal length, through a process known as recycling. This process automatically repeats the smaller vector until it matches the length of the larger vector. R will provide a warning if the larger vector is not a multiple of the smaller vector.
R
x <- c(1, 2, 3)
y <- c(1, 2, 3, 4, 5, 6, 7)
x + y
警告
Warning in x + y: longer object length is not a multiple of shorter object
length
出力
[1] 2 4 6 5 7 9 8Vector x was recycled to match the length of vector
y
- Use vectorized operations instead of loops.
