Producing Reports With knitr
最終更新日:2025-11-11 | ページの編集
概要
質問
- How can I integrate software and reports?
目的
- Understand the value of writing reproducible reports
- Learn how to recognise and compile the basic components of an R Markdown file
- Become familiar with R code chunks, and understand their purpose, structure and options
- Demonstrate the use of inline chunks for weaving R outputs into text blocks, for example when discussing the results of some calculations
- Be aware of alternative output formats to which an R Markdown file can be exported
データ分析報告
データ分析家は、協力者や、将来参照する文章として、分析及び結果を記した 報告を数多く書く傾向にあります。
Many new users begin by first writing a single R script containing all of their work, and then share the analysis by emailing the script and various graphs as attachments. But this can be cumbersome, requiring a lengthy discussion to explain which attachment was which result.
Writing formal reports with Word or LaTeX can simplify this process by incorporating both the analysis report and output graphs into a single document. But tweaking formatting to make figures look correct and fixing obnoxious page breaks can be tedious and lead to a lengthy “whack-a-mole” game of fixing new mistakes resulting from a single formatting change.
Creating a report as a web page (which is an html file) using R Markdown makes things easier. The report can be one long stream, so tall figures that wouldn’t ordinarily fit on one page can be kept at full size and easier to read, since the reader can simply keep scrolling. Additionally, the formatting of and R Markdown document is simple and easy to modify, allowing you to spend more time on your analyses instead of writing reports.
読み書きできるプログラミング
分析報告書のようなものは、再現できる 文書であることが理想です。つまり、 エラーが見つかった場合や、データに追加があった場合など、単に報告書を 再コンパイルすることで、新しい、または正しい結果が得られるという形です (再現できない文書の場合、図を再作成し、Word文書に貼り付け、更に手作業で 様々な詳細結果に手を加えなえればなりません)。
The key R package here is knitr. It allows you
to create a document that is a mixture of text and chunks of code.
文書がknitrで処理される際にRコードが実行され、
グラフや他の結果が文書に挿入されます。
こういうものを「読み書きできるプログラミング(literate programming)」と呼びます。
knitr allows you to mix basically any type of text with
code from different programming languages, but we recommend that you use
R Markdown, which mixes Markdown with R. Markdown is a light-weight
mark-up language for creating web pages.
R Markdownファイルの作成
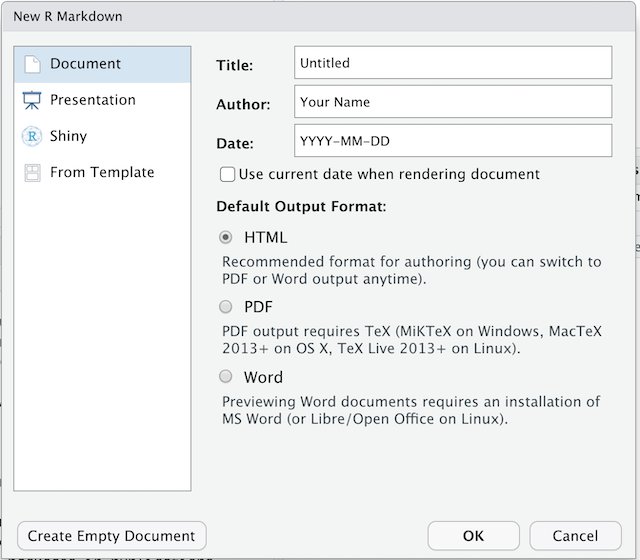
R Studioで、File New File R Markdown をクリックしましょう。 すると、次のようなダイアログボックスが出ます:

デフォルト(HTML output)のままでよいので、タイトルを付けましょう。
R Markdownの基本構成要素
The initial chunk of text (header) contains instructions for R to specify what kind of document will be created, and the options chosen. You can use the header to give your document a title, author, date, and tell it what type of output you want to produce. In this case, we’re creating an html document.
---
title: "Initial R Markdown document"
author: "Karl Broman"
date: "April 23, 2015"
output: html_document
---
入れたくなければ、これらのフィールドのいずれも消すことができます。 二重引用符は、厳密には 必須 ではありません。 大抵は、タイトルにコロンを含めたいときに使います。
RStudioは、始めやすいように、例がいくつか入れられてある文書を作成します。 以下のような「チャンク(chunk)」がすでにあるかと思います:
``{r}
summary(cars)
```
これらはRコードの「チャンク」(塊)で、knitrによってコードが実行され、結果に置き換えられます。 また後ほど、詳しくお伝えします。
Markdown
Markdown is a system for writing web pages by marking up the text much as you would in an email rather than writing html code. The marked-up text gets converted to html, replacing the marks with the proper html code.
とりあえず、ここにあるものを全部消して、少しMarkdownを書いてみましょう。
二重アスタリスクを使って、 太字 に(例 bold)、
下線を使って、 斜体 にすることができます(例
_italics_)。
You can make a bulleted list by writing a list with hyphens or asterisks with a space between the list and other text, like this:
太字は、二重アスタリスクで 斜体は、下線で コードタイプのフォントは括弧でまたは、このように:
太字は、二重アスタリスクで - 斜体は、下線で - コードタイプのフォントは括弧でそれぞれ、以下の形で表示されます:
- 太字は、二重アスタリスクで
- 斜体は、下線で
- コードタイプのフォントは括弧で
You can use whatever method you prefer, but be consistent. This maintains the readability of your code.
数字を使って番号付きリストを作ることもできます。 同じ番号を何度でも好きなだけ使えます:
1. 太字は、二重アスタリスクで 1. 斜体は、下線で 1. コードタイプのフォントは括弧でこれは、次のように表示されます:
- 太字は、二重アスタリスクで
- 斜体は、下線で
- コードタイプのフォントは括弧で
行の頭に #
印を好きな数つけることで、色々なサイズの文節の題名を作ることができます:
# タイトル ## 主文節 ### 副文節 #### 更なる副文節You compile the R Markdown document to an html webpage by clicking the “Knit” button in the upper-left.
チャレンジ1
Create a new R Markdown document. Delete all of the R code chunks and write a bit of Markdown (some sections, some italicized text, and an itemized list).
Convert the document to a webpage.
In RStudio, select File > New file > R Markdown…
Delete the placeholder text and add the following:
# Introduction

## Background on Data

This report uses the *gapminder* dataset, which has columns that include:

* country
* continent
* year
* lifeExp
* pop
* gdpPercap

## Background on Methods
Then click the ‘Knit’ button on the toolbar to generate an html document (webpage).
もうちょっとMarkdownについて
次のような、ハイパーリンクを作ることができます:
[表示するテキスト](https://carpentries.org/).
You can include an image file like this:

下付き文字 (例 F2)は F~2 で、上付き文字(例
F2)は F^2^ でできます。
LaTeXの等式の書き方を知っていれば、
$ $ と $$ $$ で数式を挿入することができます。
例えば、 $E = mc^2$ や、
$$y = \mu + \sum_{i=1}^p \beta_i x_i + \epsilon$$You can review Markdown syntax by navigating to the “Markdown Quick Reference” under the “Help” field in the toolbar at the top of RStudio.
Rコードの「チャンク(塊)」
The real power of Markdown comes from mixing markdown with chunks of code. This is R Markdown. When processed, the R code will be executed; if they produce figures, the figures will be inserted in the final document.
メインのコードチャンクは、こんな感じです:
``{r load_data}
gapminder
That is, you place a chunk of R code between ```{r
chunk_name} and ```.
そうすると、エラーを修正するときに役立ちますし、グラフのファイル名は、生成されたコードのチャンクの名前に基づいて付けられるからです。
You can create code chunks quickly in RStudio using the shortcuts
Ctrl+Alt+I on Windows and Linux, or
Cmd+Option+I on Mac.
チャレンジ
チャレンジ2
Add code chunks to:
- Load the ggplot2 package
- Read the gapminder data
- Create a plot
``{r load-ggplot2}
library("ggplot2")
```
``{r read-gapminder-data}
gapminder
``{r make-plot}
plot(lifeExp ~ year, data = gapminder)
```
どうコンパイルされるか
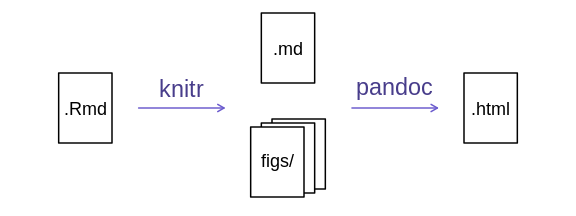
「Knit HTML」ボタンを押すと、R Markdown文書はknitr によって処理され、単純なMarkdown文書が(一連の図のファイルと共に)生成されます。 Rコードは実行され、入力と出力に置き換えられます。図が生成された場合、 これらの図へのリンクが挿入されます。
Markdownと図の文書は、pandoc というツールで処理され、 Markdownファイルは、図の埋め込まれたhtmlファイルに変換されます。

チャンクのオプション
コードのチャンクがどう扱われるかは、様々なオプションによって決められます。 Here are some examples:
- コード自体を見せないためには、
echo=FALSEを使います
- コード自体を見せないためには、
- 結果を表示しないためには、
results="hide"を使います
- 結果を表示しないためには、
- コードを演算せず表示するためには、
eval=FALSEを使います
- コードを演算せず表示するためには、
- 警告やメッセージを隠す場合は、
warning=FALSEとmessage=FALSEを使います
- 警告やメッセージを隠す場合は、
- 生成される図の大きさを(インチで)管理するためには、
fig.heightとfig.widthを使います
- 生成される図の大きさを(インチで)管理するためには、
なので、書くとすれば:
``{r load_libraries, echo=FALSE, message=FALSE}
library("dplyr")
library("ggplot2")
```
使いたいオプションを別のチャンクでも使いたい場合は、 global_options を使います。例えば:
``{r global_options, echo=FALSE}
knitr::opts_chunk$set(fig.path="Figs/", message=FALSE, warning=FALSE,
                      echo=FALSE, results="hide", fig.width=11)
```
fig.path
オプションは、図のファイルがどこに保存されるかを定義します。 ここでの
/ はとても重要で、もしこれがなければ、図は標準的な場所に
保存されますが、 Figs
で始まる名前のファイルだけになります。
共有ディレクトリにR Markdownファイルが複数ある場合は、
fig.path
を図のファイル名と異なる接頭語を付けるために使うといいかもしれません。
例えば、fig.path="Figs/cleaning-" と
fig.path="Figs/analysis-" とすれば、 それぞれ
"cleaning-" と "analysis-"
で始まる図のファイルが "Figs/"
ディレクトリに保存されます。
チャレンジ3
図の大きさを管理し、コードを隠すチャンクのオプションを使ってみましょう。
``{r echo = FALSE, fig.width = 3}
plot(faithful)
```
You can review all of the R chunk options by navigating
to the “R Markdown Cheat Sheet” under the “Cheatsheets” section of the
“Help” field in the toolbar at the top of RStudio.
文中のRコード
報告書にある、全て
の数を再現可能なものにすることができます。 インラインコードチャンクには
`r と `
で囲んで、例えばこのように記述します:r round(some_value,
2)。 このコードはコンパイル時に実行され、結果の 値
に置き換えられます。
この文中のチャンクを、複数の行に分けて入れないようにしましょう。
こういう場合は、パラグラフの前にinclude=FALSE (
echo=FALSE と results="hide"
の組み合わせと同じ)のオプションを設定した、
定義や演算を行うコードチャンクを作っておきましょう。
Rounding can produce differences in output in such situations.
2.0 が欲しくても、round(2.03, 1) ではただの
2 が出てきてしまいます。
R/bromanパッケージにある、
myround関数が、
この問題に対処してくれます。
チャレンジ4
文中のRコードを少し試してみましょう。
Here’s some inline code to determine that 2 + 2 = 4.
その他の出力オプション
R MarkdownをPDFやWord文書に変換することもできます。
ドロップダウンメニューを表示させるために、「Knit
HTML」の横にある小さい三角をクリックしましょう。 または、
pdf_document や word_document
をファイルの最初のヘッダー(header)に入れておくこともできます。
ヒント:PDFドキュメントの作成
.pdf
文書を作成するためには、いくつかソフトウェアをインストールしなければいけないかもしれません。
The R package tinytex provides some tools to help make this
process easier for R users. With tinytex installed, run
tinytex::install_tinytex() to install the required software
(you’ll only need to do this once) and then when you knit to pdf
tinytex will automatically detect and install any
additional LaTeX packages that are needed to produce the pdf document.
Visit the tinytex website for
more information.
Tip: Visual markdown editing in RStudio
RStudio versions 1.4 and later include visual markdown editing mode.
In visual editing mode, markdown expressions (like
**bold words**) are transformed to the formatted appearance
(bold words) as you type. This mode also includes a
toolbar at the top with basic formatting buttons, similar to what you
might see in common word processing software programs. You can turn
visual editing on and off by pressing the ![]() button in the top right corner of your R Markdown document.
button in the top right corner of your R Markdown document.
資料
- Knitr in a knutshell tutorial
- Dynamic Documents with R and knitr (book)
- R Markdown documentation
- R Markdown cheat sheet
- Getting started with R Markdown
- R Markdown: The Definitive Guide (book by Rstudio team)
- Reproducible Reporting
- The Ecosystem of R Markdown
- Introducing Bookdown
- Mix reporting written in R Markdown with software written in R.
- Specify chunk options to control formatting.
- Use
knitrto convert these documents into PDF and other formats.
