Data Frame Manipulation with dplyr
最終更新日:2025-11-11 | ページの編集
所要時間: 55分
概要
質問
- How can I manipulate data frames without repeating myself?
目的
- To be able to use the six main data frame manipulation ‘verbs’ with
pipes in
dplyr. - To understand how
group_by()andsummarize()can be combined to summarize datasets. - Be able to analyze a subset of data using logical filtering.
多くの研究者にとって、データフレームの操作は、多くのことを意味します。 よくあるのは、特定の観測値(行)もしくは変数(列)の選択、 特定の変数でのデータのグループ化、 更には要約する統計値の計算です。 これらは、普通のRの基本操作で実行できます: We can do these operations using the normal base R operations:
R
mean(gapminder$gdpPercap[gapminder$continent == "Africa"])
出力
[1] 2193.755R
mean(gapminder$gdpPercap[gapminder$continent == "Americas"])
出力
[1] 7136.11R
mean(gapminder$gdpPercap[gapminder$continent == "Asia"])
出力
[1] 7902.15でも、これはあまり おススメ ではありません。繰り返しがかなりあるからです。 繰り返し作業は、時間を食います。そして、嫌なバグを起こる原因にもなりえます。
dplyr パッケージ
嬉しいことに、dplyr
パッケージには、データフレーム操作に非常に役立つ関数がいくつもあります。
それを使うと、先ほどみたような繰り返しを減らし、エラーを起こす確率を減らし、
タイピングする必要性さえも恐らく減らせます。 更には、dplyr
の書き方は、とても分かりやすいかもしれません。 As an added bonus, you
might even find the dplyr grammar easier to read.
Tip: Tidyverse
dplyr package belongs to a broader family of opinionated
R packages designed for data science called the “Tidyverse”. These
packages are specifically designed to work harmoniously together. Some
of these packages will be covered along this course, but you can find
more complete information here: https://www.tidyverse.org/.
ここでは、特によく使われる6つの関数と、
それらを組み合わせるためのパイプ(% %)を紹介します。 .
select()filter()group_by()summarize()mutate()
もし、このパッケージをまだインストールしていないようでしたら、ここでしておきましょう:
R
install.packages('dplyr')
パッケージをロードしましょう:
R
library("dplyr")
select() の使用
例えば、
データフレームにある、いくつかの変数だけを使って進めたい場合、
使えるかもしれないのは、select() 関数です。
これを使えば、選択した変数だけをキープすることができます。
R
year_country_gdp <- select(gapminder, year, country, gdpPercap)
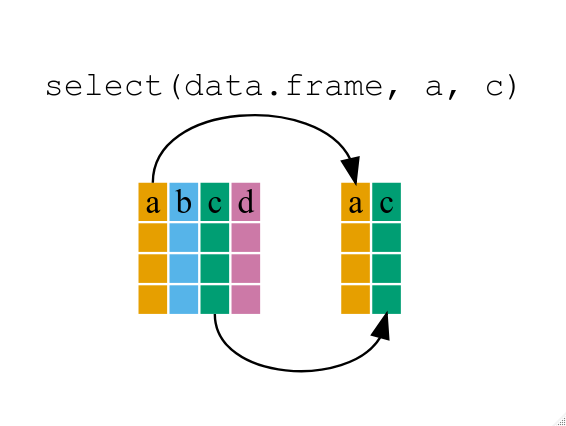 If we want to remove one column only from the
 gapminder
data, for example, removing the continent column.
R
smaller_gapminder_data <- select(gapminder, -continent)
もし year_country_gdp を開いたら、year、country 及び
gdpPercap しかないでしょう。 これまでは、 ‘普通の’
書き方を使いましたが、dplyr の強みは、複数の関数を
パイプを使って、組み合わせられることです。
パイプの書き方は、これまでRで見てきたものとは、
全く違いますので、上記でしたことをパイプを使って、やってみましょう。
R
year_country_gdp <- gapminder %>% select(year, country, gdpPercap)
To help you understand why we wrote that in that way, let’s walk
through it step by step. First we summon the gapminder data frame and
pass it on, using the pipe symbol %>%, to the next step,
which is the select() function. In this case we don’t
specify which data object we use in the select() function
since in gets that from the previous pipe. Fun Fact:
There is a good chance you have encountered pipes before in the shell.
In R, a pipe symbol is %>% while in the shell it is
| but the concept is the same!
Tip: Renaming data frame columns in dplyr
In Chapter 4 we covered how you can rename columns with base R by
assigning a value to the output of the names() function.
Just like select, this is a bit cumbersome, but thankfully dplyr has a
rename() function.
Within a pipeline, the syntax is
rename(new_name = old_name). For example, we may want to
rename the gdpPercap column name from our select()
statement above.
R
tidy_gdp <- year_country_gdp %>% rename(gdp_per_capita = gdpPercap)

head(tidy_gdp)
出力
  year     country gdp_per_capita
1 1952 Afghanistan       779.4453
2 1957 Afghanistan       820.8530
3 1962 Afghanistan       853.1007
4 1967 Afghanistan       836.1971
5 1972 Afghanistan       739.9811
6 1977 Afghanistan       786.1134
filter() の使用
欧州のみで、上記を進めたいとしたら、 select と
filter を組み合わせましょう。
R
year_country_gdp_euro <- gapminder %>%
    filter(continent == "Europe") %>%
    select(year, country, gdpPercap)
If we now want to show life expectancy of European countries but only for a specific year (e.g., 2007), we can do as below.
R
europe_lifeExp_2007 <- gapminder %>%
  filter(continent == "Europe", year == 2007) %>%
  select(country, lifeExp)
チャレンジ1
Write a single command (which can span multiple lines and includes
pipes) that will produce a data frame that has the African values for
lifeExp, country and year, but
not for other Continents. How many rows does your data frame have and
why?
R
year_country_lifeExp_Africa <- gapminder %>%
                           filter(continent == "Africa") %>%
                           select(year, country, lifeExp)
以前行ったように、gapminder データフレームを filter()
関数に引き渡し、 フィルターされた バージョンのgapminder
データフレームを、 select() 関数に引き渡します。 注意:
ここでは、操作手順がとても重要です。 まず ‘select’
を使うと、その前のステップで、大陸の変数が削除されているため、 filter
で大陸の変数を見つけることができないことでしょう。
Using group_by()
Now, we were supposed to be reducing the error prone repetitiveness
of what can be done with base R, but up to now we haven’t done that
since we would have to repeat the above for each continent. Instead of
filter(), which will only pass observations that meet your
criteria (in the above: continent=="Europe"), we can use
group_by(), which will essentially use every unique
criteria that you could have used in filter.
R
str(gapminder)
出力
'data.frame':	1704 obs. of  6 variables:
 $ country  : chr  "Afghanistan" "Afghanistan" "Afghanistan" "Afghanistan" ...
 $ year     : int  1952 1957 1962 1967 1972 1977 1982 1987 1992 1997 ...
 $ pop      : num  8425333 9240934 10267083 11537966 13079460 ...
 $ continent: chr  "Asia" "Asia" "Asia" "Asia" ...
 $ lifeExp  : num  28.8 30.3 32 34 36.1 ...
 $ gdpPercap: num  779 821 853 836 740 ...
R
str(gapminder %>% group_by(continent))
出力
gropd_df [1,704 × 6] (S3: grouped_df/tbl_df/tbl/data.frame)
 $ country  : chr [1:1704] "Afghanistan" "Afghanistan" "Afghanistan" "Afghanistan" ...
 $ year     : int [1:1704] 1952 1957 1962 1967 1972 1977 1982 1987 1992 1997 ...
 $ pop      : num [1:1704] 8425333 9240934 10267083 11537966 13079460 ...
 $ continent: chr [1:1704] "Asia" "Asia" "Asia" "Asia" ...
 $ lifeExp  : num [1:1704] 28.8 30.3 32 34 36.1 ...
 $ gdpPercap: num [1:1704] 779 821 853 836 740 ...
 - attr(*, "groups")= tibble [5 × 2] (S3: tbl_df/tbl/data.frame)
  ..$ continent: chr [1:5] "Africa" "Americas" "Asia" "Europe" ...
  ..$ .rows    : list<int> [1:5]
  .. ..$ : int [1:624] 25 26 27 28 29 30 31 32 33 34 ...
  .. ..$ : int [1:300] 49 50 51 52 53 54 55 56 57 58 ...
  .. ..$ : int [1:396] 1 2 3 4 5 6 7 8 9 10 ...
  .. ..$ : int [1:360] 13 14 15 16 17 18 19 20 21 22 ...
  .. ..$ : int [1:24] 61 62 63 64 65 66 67 68 69 70 ...
  .. ..@ ptype: int(0)
  ..- attr(*, ".drop")= logi TRUE
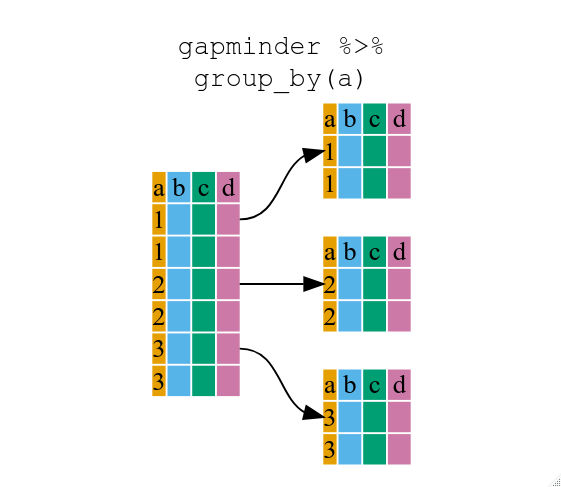
group_by()
(grouped_df)で用いたデータフレームのデータ構造は、もともとの
gapminder
(data.frame)とは異なることに気づいたことでしょう。
grouped_df は、 list のようなものです。その
list にある各項目は、 (少なくとも上記の例では)特定の
continent の値が対応する列のみを含む
data.frame になります。
summarize() の使用
The above was a bit on the uneventful side but
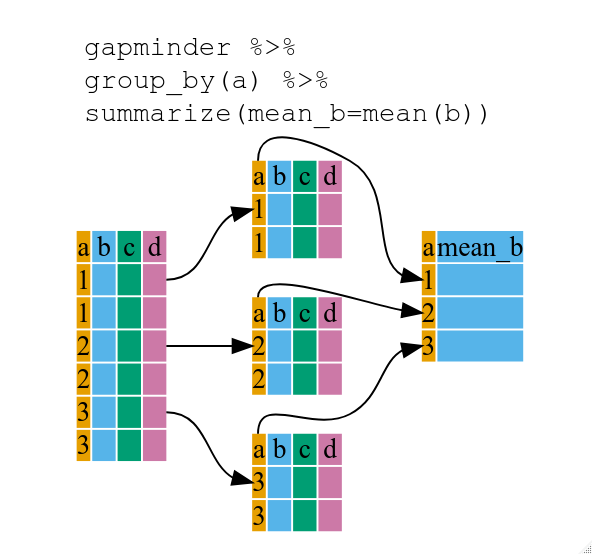
group_by() is much more exciting in conjunction with
summarize(). This will allow us to create new variable(s)
by using functions that repeat for each of the continent-specific data
frames. That is to say, using the group_by() function, we
split our original data frame into multiple pieces, then we can run
functions (e.g. mean() or sd()) within
summarize().
R
gdp_bycontinents <- gapminder %>%
    group_by(continent) %>%
    summarize(mean_gdpPercap = mean(gdpPercap))
R
continent mean_gdpPercap
     <fctr>          <dbl>
1    Africa       2193.755
2  Americas       7136.110
3      Asia       7902.150
4    Europe      14469.476
5   Oceania      18621.609
これにより、それぞれの大陸の平均gdpPercapを計算することができますが、 更に、すばらしいことがあるのです。
チャレンジ2
Calculate the average life expectancy per country. Which has the longest average life expectancy and which has the shortest average life expectancy?
R
lifeExp_bycountry <- gapminder %>%
   group_by(country) %>%
   summarize(mean_lifeExp = mean(lifeExp))
lifeExp_bycountry %>%
   filter(mean_lifeExp == min(mean_lifeExp) | mean_lifeExp == max(mean_lifeExp))
出力
# A tibble: 2 × 2
  country      mean_lifeExp
  <chr>               <dbl>
1 Iceland              76.5
2 Sierra Leone         36.8
Another way to do this is to use the dplyr function
arrange(), which arranges the rows in a data frame
according to the order of one or more variables from the data frame. It
has similar syntax to other functions from the dplyr
package. You can use desc() inside arrange()
to sort in descending order.
R
lifeExp_bycountry %>%
   arrange(mean_lifeExp) %>%
   head(1)
出力
# A tibble: 1 × 2
  country      mean_lifeExp
  <chr>               <dbl>
1 Sierra Leone         36.8
R
lifeExp_bycountry %>%
   arrange(desc(mean_lifeExp)) %>%
   head(1)
出力
# A tibble: 1 × 2
  country mean_lifeExp
  <chr>          <dbl>
1 Iceland         76.5
Alphabetical order works too
R
lifeExp_bycountry %>%
   arrange(desc(country)) %>%
   head(1)
出力
# A tibble: 1 × 2
  country  mean_lifeExp
  <chr>           <dbl>
1 Zimbabwe         52.7
group_by()
の関数では、複数の変数でグループ化するこもできます。 year
と continent でグループ分けしてみましょう。
R
gdp_bycontinents_byyear <- gapminder %>%
    group_by(continent, year) %>%
    summarize(mean_gdpPercap = mean(gdpPercap))
出力
`summarise()` has grouped output by 'continent'. You can override using the
`.groups` argument.
That is already quite powerful, but it gets even better! You’re not
limited to defining 1 new variable in summarize().
R
gdp_pop_bycontinents_byyear <- gapminder %>%
    group_by(continent, year) %>%
    summarize(mean_gdpPercap = mean(gdpPercap),
              sd_gdpPercap = sd(gdpPercap),
              mean_pop = mean(pop),
              sd_pop = sd(pop))
出力
`summarise()` has grouped output by 'continent'. You can override using the
`.groups` argument.
count() 及び n()
A very common operation is to count the number of observations for
each group. The dplyr package comes with two related
functions that help with this.
例えば、2002年のデータセットにある国の数を確認したい場合、
count() 関数が使えます。
興味のあるグループのひとつかいくつかの行の名前を取り、
sort=TRUE
を加えることで、結果を降順に並べることもできます:
R
gapminder %>%
    filter(year == 2002) %>%
    count(continent, sort = TRUE)
出力
  continent  n
1    Africa 52
2      Asia 33
3    Europe 30
4  Americas 25
5   Oceania  2
演算の際の観測値の数が必要な場合 n() 関数が使えます。 It
will return the total number of observations in the current group rather
than counting the number of observations in each group within a specific
column. 例えば、大陸別平均余命の標準誤差を得たいとします:
R
gapminder %>%
    group_by(continent) %>%
    summarize(se_le = sd(lifeExp)/sqrt(n()))
出力
# A tibble: 5 × 2
  continent se_le
  <chr>     <dbl>
1 Africa    0.366
2 Americas  0.540
3 Asia      0.596
4 Europe    0.286
5 Oceania   0.775
いくつかの要約計算を、つなぎ合わせることもできます。つまり、ここでは各大陸の国別平均余命の
minimum 、 maximum 、 mean 及び
se となります:
R
gapminder %>%
    group_by(continent) %>%
    summarize(
      mean_le = mean(lifeExp),
      min_le = min(lifeExp),
      max_le = max(lifeExp),
      se_le = sd(lifeExp)/sqrt(n()))
出力
# A tibble: 5 × 5
  continent mean_le min_le max_le se_le
  <chr>       <dbl>  <dbl>  <dbl> <dbl>
1 Africa       48.9   23.6   76.4 0.366
2 Americas     64.7   37.6   80.7 0.540
3 Asia         60.1   28.8   82.6 0.596
4 Europe       71.9   43.6   81.8 0.286
5 Oceania      74.3   69.1   81.2 0.775
mutate() の使用
情報を要約する前に(もしくは後にでも)、 mutate()
を使えば、新しい変数を作ることができます。
R
gdp_pop_bycontinents_byyear <- gapminder %>%
    mutate(gdp_billion = gdpPercap*pop/10^9) %>%
    group_by(continent,year) %>%
    summarize(mean_gdpPercap = mean(gdpPercap),
              sd_gdpPercap = sd(gdpPercap),
              mean_pop = mean(pop),
              sd_pop = sd(pop),
              mean_gdp_billion = mean(gdp_billion),
              sd_gdp_billion = sd(gdp_billion))
出力
`summarise()` has grouped output by 'continent'. You can override using the
`.groups` argument.
論理フィルター ifelse とmutate の併用
新しい変数を作る時、論理条件を付けることができます。
似たような組み合わせの mutate() と ifelse()
は、まさに必要な場面、つまり
新しいものを作る時に、フィルターすることができます。
この簡単に読めるコードが、(データフレーム全体の次元を変えずに)あるデータを
排除するための早くて役に立つ方法であり、
与えられた条件によって値を更新する方法なのです。
R
## keeping all data but "filtering" after a certain condition
# calculate GDP only for people with a life expectation above 25
gdp_pop_bycontinents_byyear_above25 <- gapminder %>%
    mutate(gdp_billion = ifelse(lifeExp > 25, gdpPercap * pop / 10^9, NA)) %>%
    group_by(continent, year) %>%
    summarize(mean_gdpPercap = mean(gdpPercap),
              sd_gdpPercap = sd(gdpPercap),
              mean_pop = mean(pop),
              sd_pop = sd(pop),
              mean_gdp_billion = mean(gdp_billion),
              sd_gdp_billion = sd(gdp_billion))
出力
`summarise()` has grouped output by 'continent'. You can override using the
`.groups` argument.
R
## updating only if certain condition is fullfilled
# for life expectations above 40 years, the gpd to be expected in the future is scaled
gdp_future_bycontinents_byyear_high_lifeExp <- gapminder %>%
    mutate(gdp_futureExpectation = ifelse(lifeExp > 40, gdpPercap * 1.5, gdpPercap)) %>%
    group_by(continent, year) %>%
    summarize(mean_gdpPercap = mean(gdpPercap),
              mean_gdpPercap_expected = mean(gdp_futureExpectation))
出力
`summarise()` has grouped output by 'continent'. You can override using the
`.groups` argument.
dplyr と ggplot2 の併用
First install and load ggplot2:
R
install.packages('ggplot2')
R
library("ggplot2")
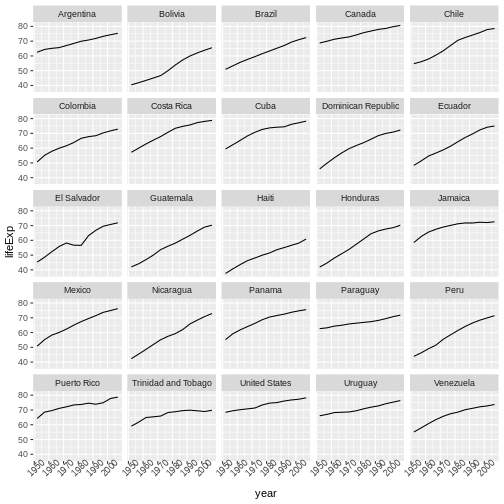
プロットのレッスンでは、 ggplot2
を使って、ファセットパネルの層を加えることで、
複数パネルの図を示す方法を見ました。
以下が、(いくつかコメントを足してありますが)使用したコードです:
R
# Filter countries located in the Americas
americas <- gapminder[gapminder$continent == "Americas", ]
# Make the plot
ggplot(data = americas, mapping = aes(x = year, y = lifeExp)) +
  geom_line() +
  facet_wrap( ~ country) +
  theme(axis.text.x = element_text(angle = 45))
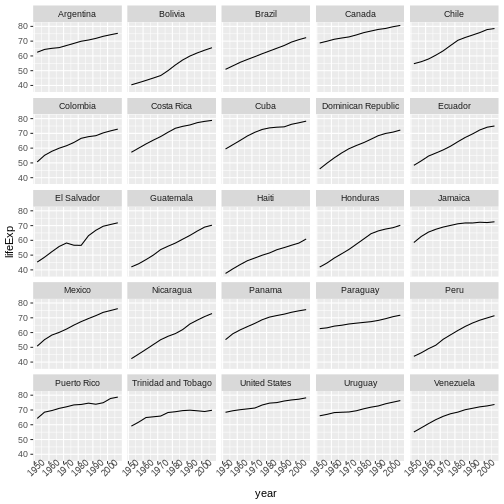
このコードは、正しいプロットを作りますが、他に使い道のない、変数(starts.with
及び az.countries)も作ります。 dplyr
関数のチェーンで、 % % を使って、
データをパイプしたように、 ggplot()
へデータを引き渡すこともできます。 なぜならば % %
は、関数の最初の引数を置き換えるため、 ggplot()
関数の中の、 data = 因数を指定する必要がありません。
dplyr と ggplot2
関数を組み合わせることで、同じ図を、新しい変数を作ったり、
データを修正することなく作成できます。
R
gapminder %>%
  # Filter countries located in the Americas
  filter(continent == "Americas") %>%
  # Make the plot
  ggplot(mapping = aes(x = year, y = lifeExp)) +
  geom_line() +
  facet_wrap( ~ country) +
  theme(axis.text.x = element_text(angle = 45))
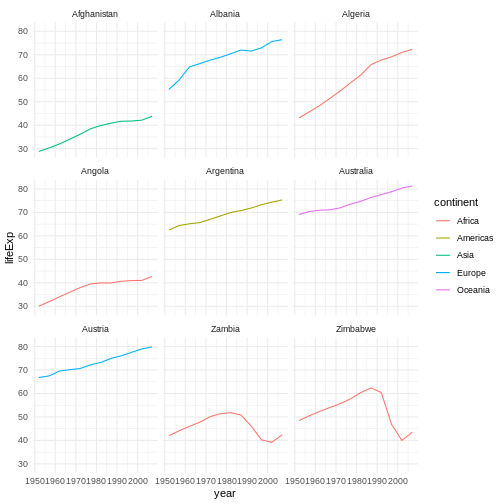
More examples of using the function mutate() and the
ggplot2 package.
R
gapminder %>%
  # extract first letter of country name into new column
  mutate(startsWith = substr(country, 1, 1)) %>%
  # only keep countries starting with A or Z
  filter(startsWith %in% c("A", "Z")) %>%
  # plot lifeExp into facets
  ggplot(aes(x = year, y = lifeExp, colour = continent)) +
  geom_line() +
  facet_wrap(vars(country)) +
  theme_minimal()
上級チャレンジ
各大陸から無作為に選ばれた2つの国の2002年の平均余命を計算し、
大陸名を、逆の順番に並べましょう。 ヒント: dplyr 関数
arrange() 及び sample_n() を使いましょう。
書き方は、他の dplyr 関数と同じです。
R
lifeExp_2countries_bycontinents <- gapminder %>%
   filter(year==2002) %>%
   group_by(continent) %>%
   sample_n(2) %>%
   summarize(mean_lifeExp=mean(lifeExp)) %>%
   arrange(desc(mean_lifeExp))
その他役に立つ資料
- R for Data Science (online book)
- Data Wrangling Cheat sheet (pdf file)
- Introduction to dplyr (online documentation)
- Data wrangling with R and RStudio (online video)
- Tidyverse Skills for Data Science (online book)
- Use the
dplyrpackage to manipulate data frames. - Use
select()to choose variables from a data frame. - Use
filter()to choose data based on values. - Use
group_by()andsummarize()to work with subsets of data. - Use
mutate()to create new variables.
