画像1/1: ‘Exponential increase of the number of packages available on [CRAN](https://cran.r-project.org/), the Comprehensive R Archive Network. From the R Journal, Volume 10/2, December 2018.’
Exponential increase of the number of packages available on CRAN, the Comprehensive R Archive
Network. From the R Journal, Volume 10/2, December 2018.
図の2
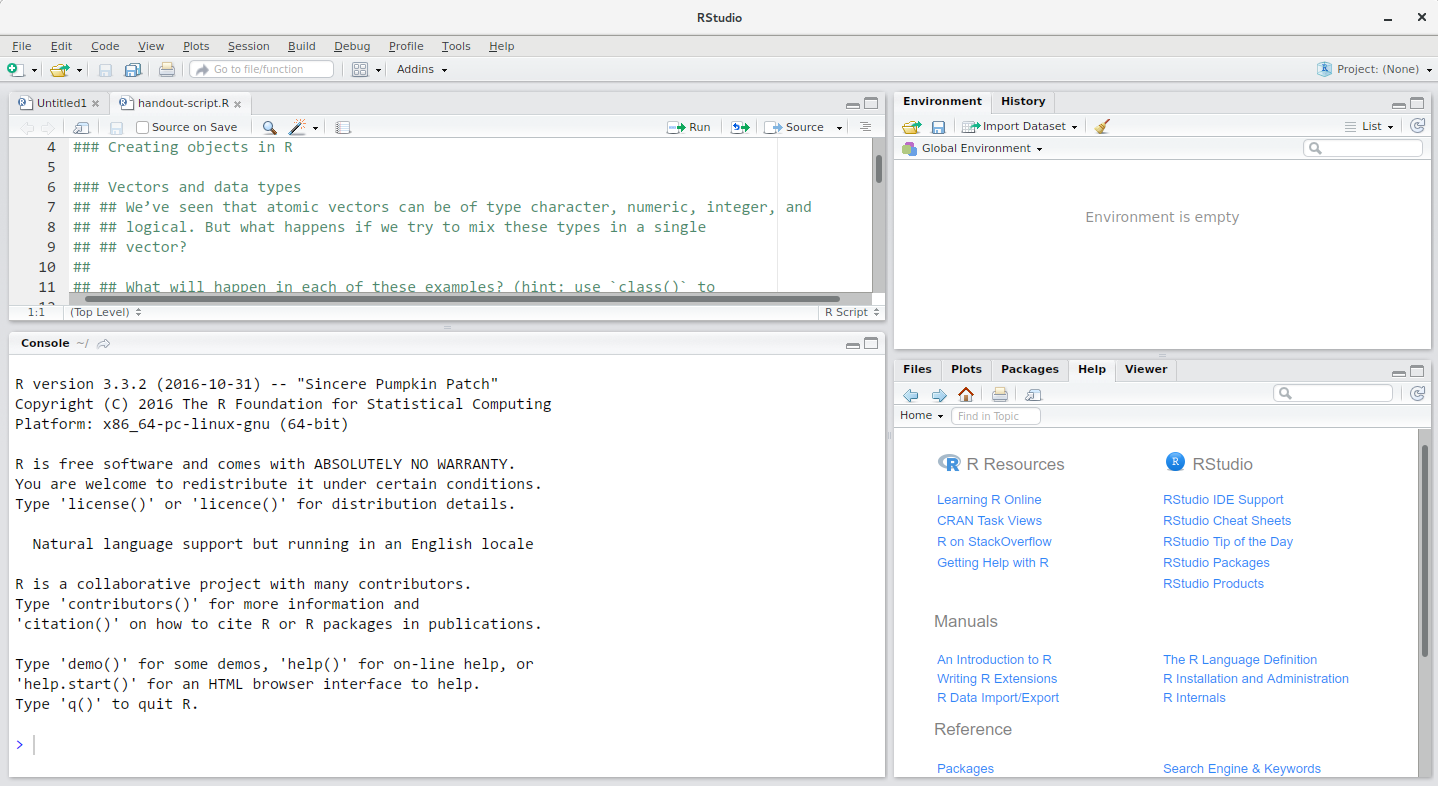
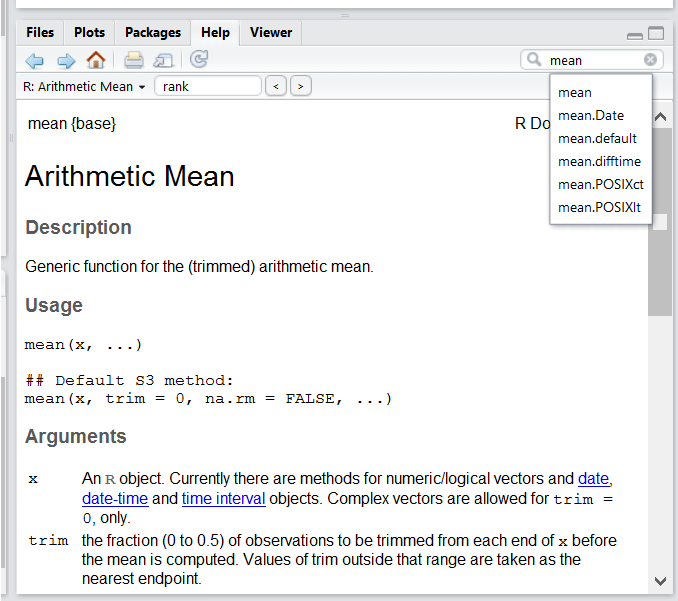
画像1/1: ‘RStudio interface screenshot. Clockwise from top left: Source, Environment/History, Files/Plots/Packages/Help/Viewer, Console.’
RStudio interface screenshot. Clockwise from top left: Source,
Environment/History, Files/Plots/Packages/Help/Viewer, Console.
図の3
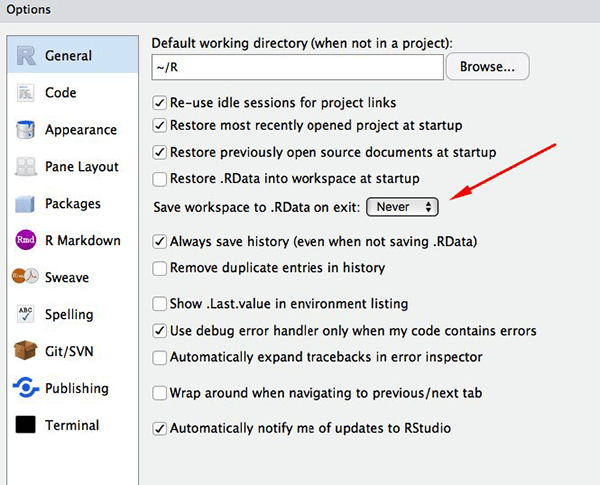
画像1/1: ‘Set 'Save workspace to .RData on exit' to 'Never'’
Set ‘Save workspace to .RData on exit’ to ‘Never’
図の4
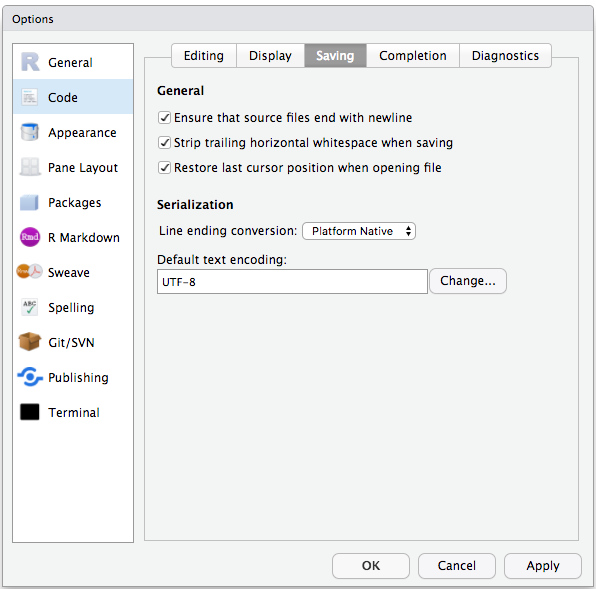
画像1/1: ‘Set the default text encoding to UTF-8 to save us headache in the coming future. (Figure from the link above).’
Set the default text encoding to UTF-8 to save us headache in the coming
future. (Figure from the link above).
図の5
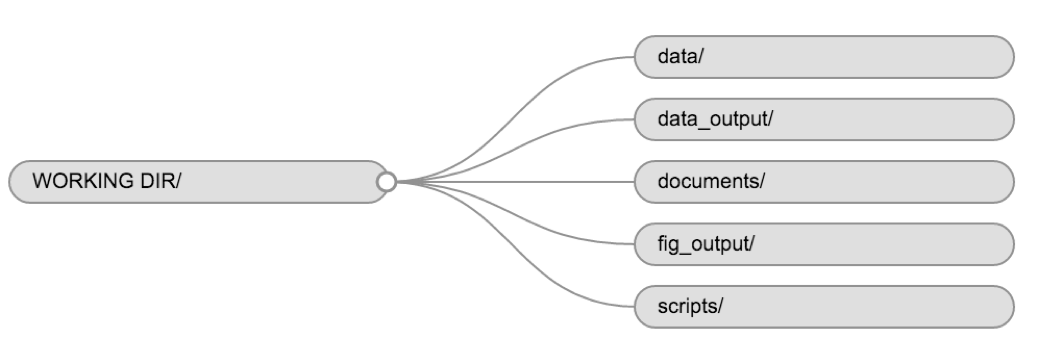
画像1/1: ‘Example of a working directory structure.’
Example of a working directory structure.
図の6
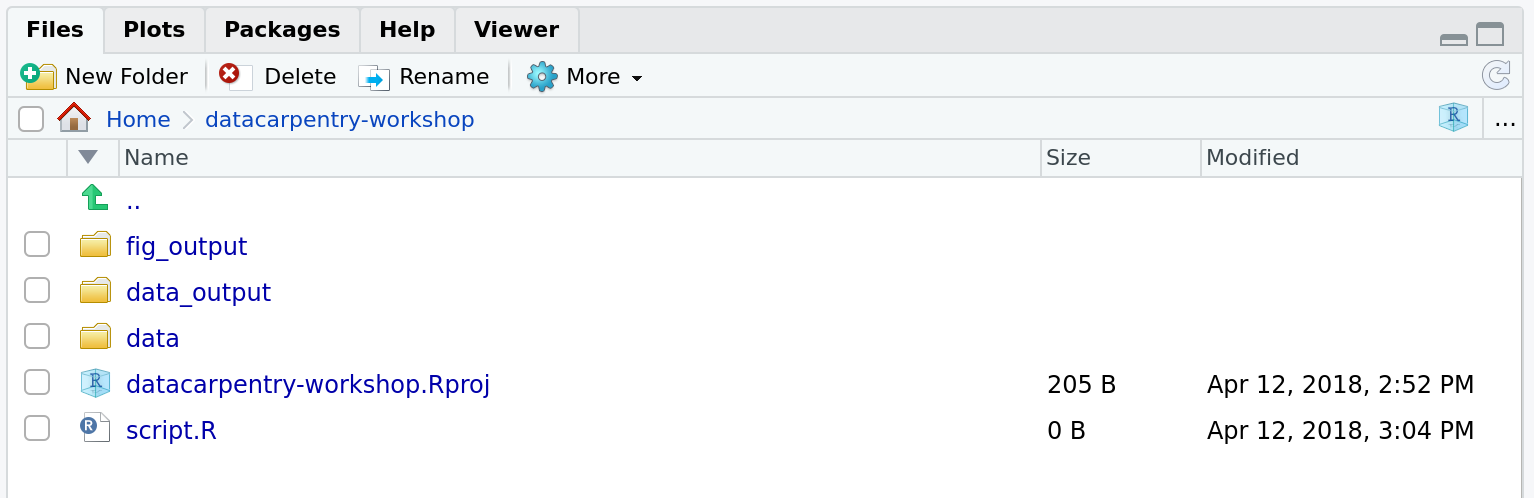
画像1/1: ‘How it should look like at the beginning of this lesson’
How it should look like at the beginning of this lesson
図の7
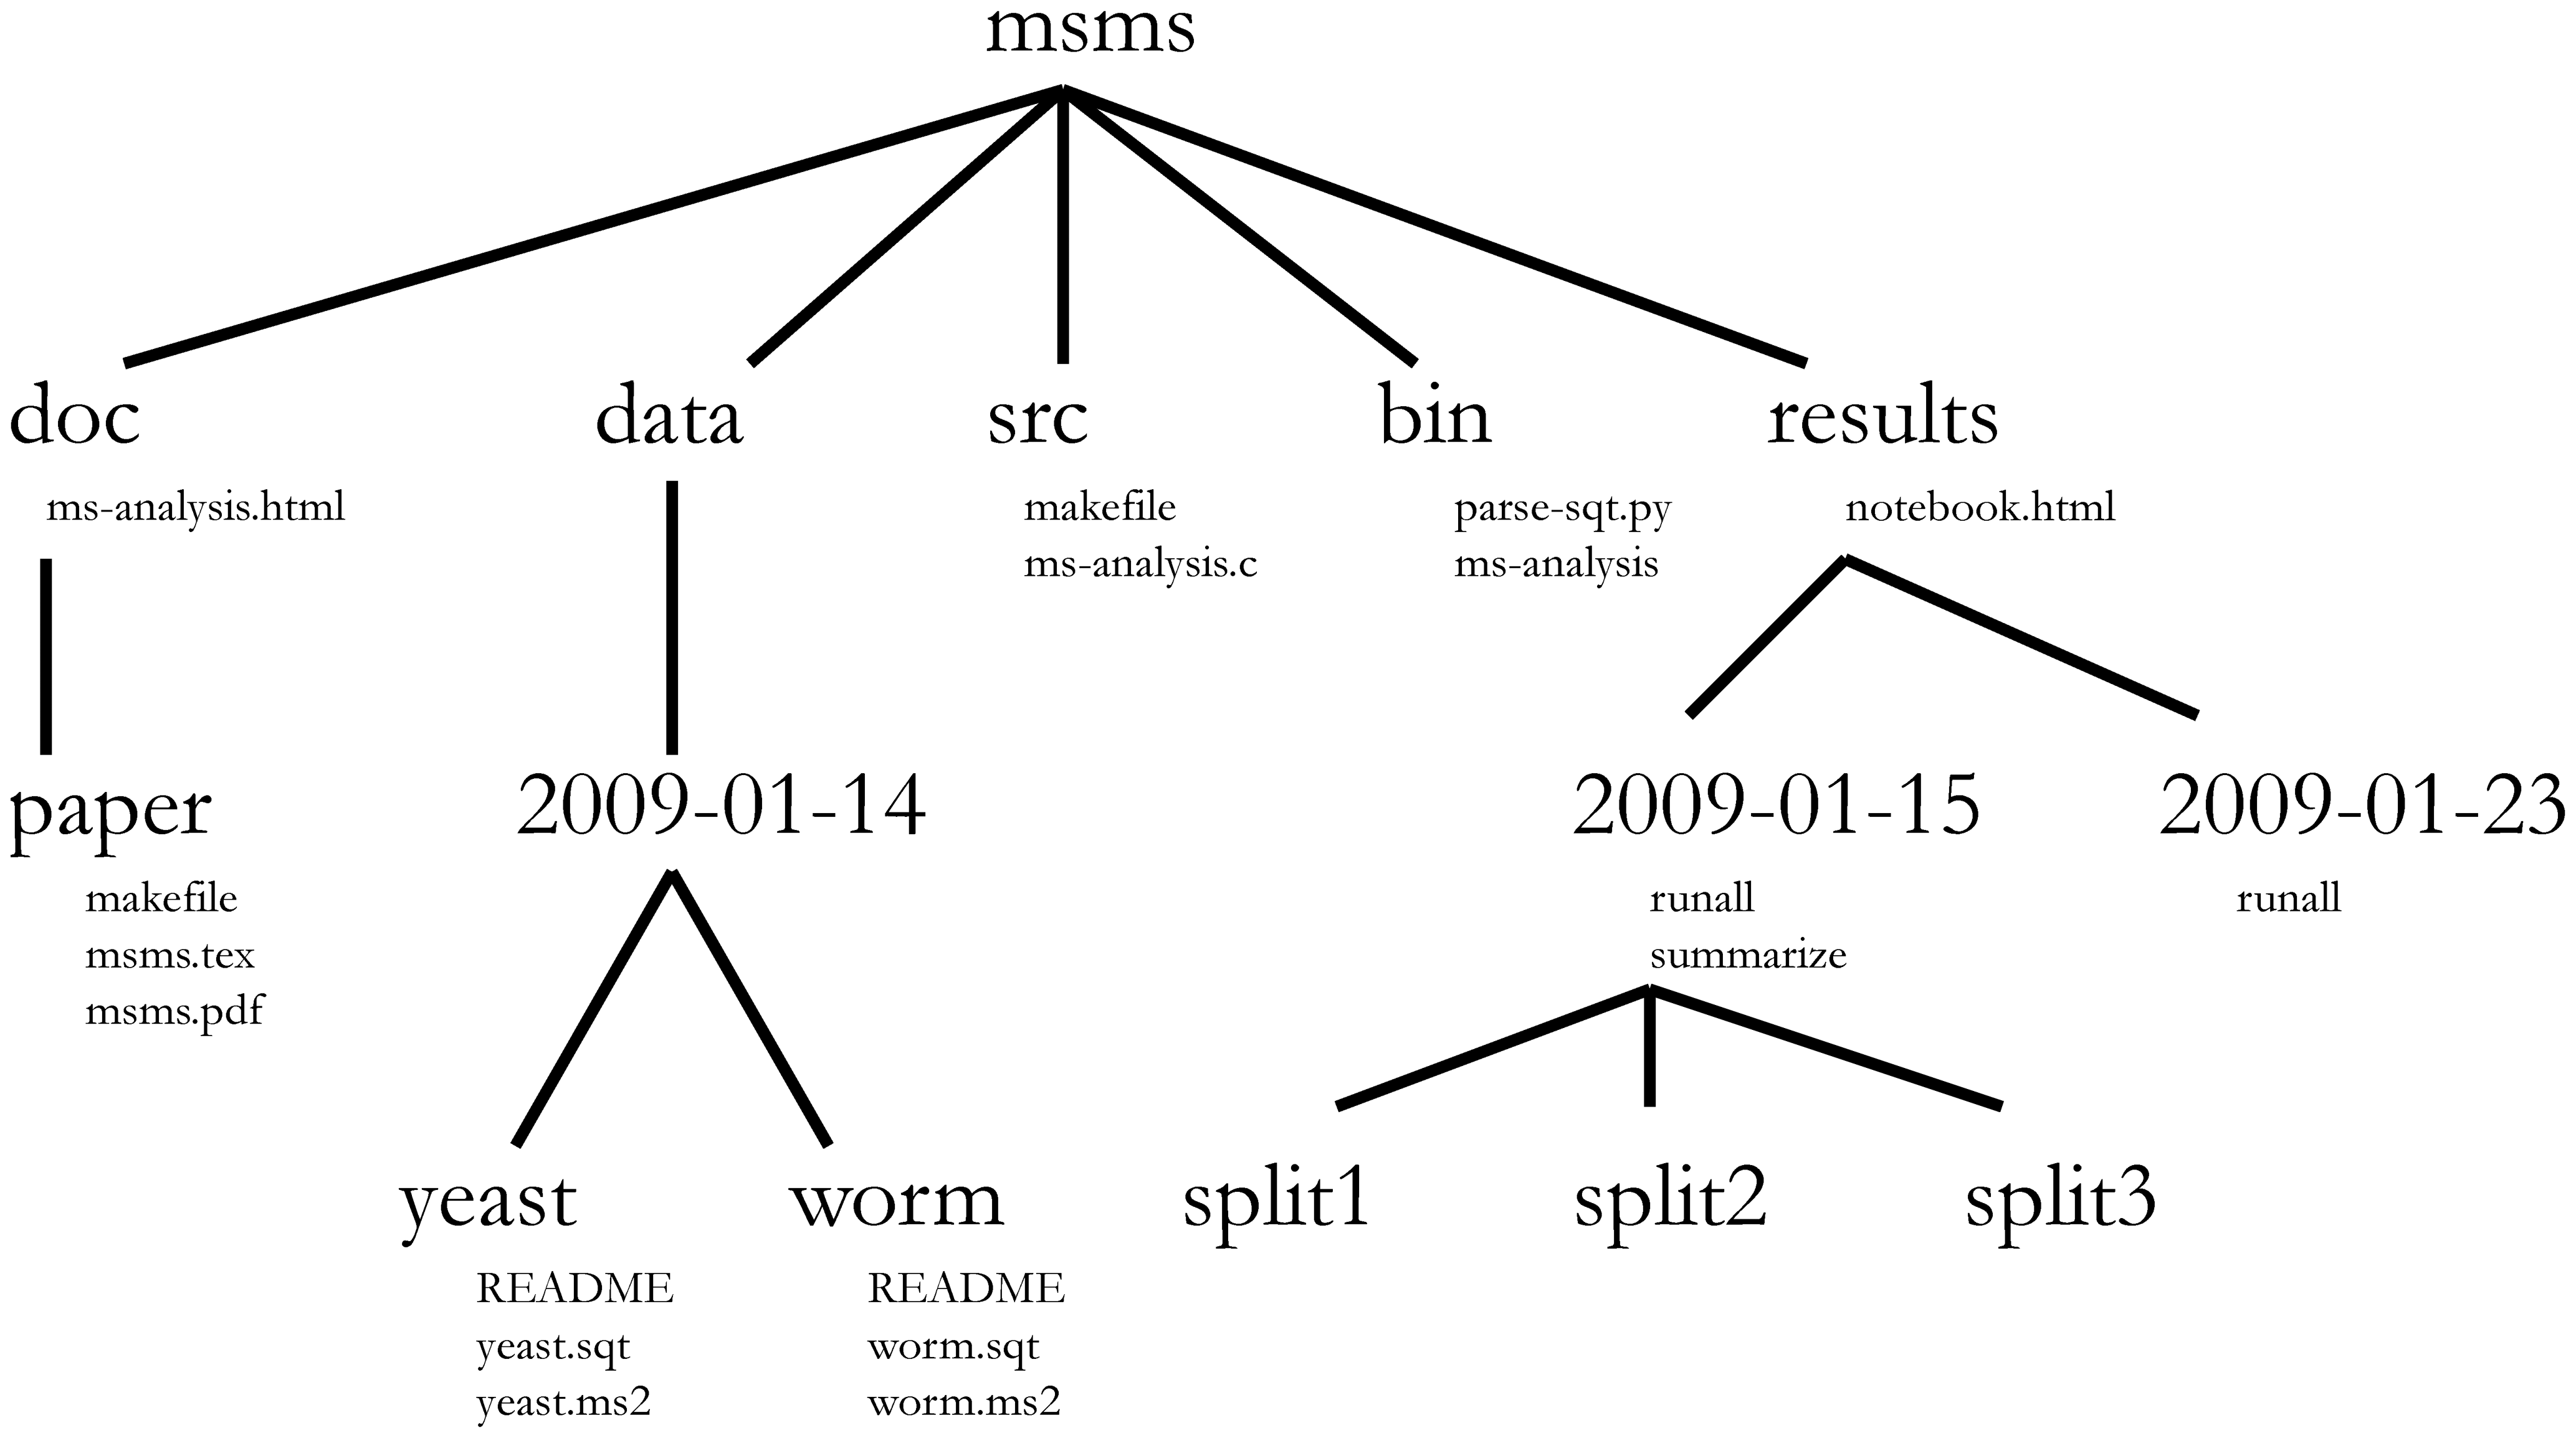
画像1/1: ‘Directory structure for a sample bioinformatics project.’
Directory structure for a sample bioinformatics project.
, the Comprehensive R Archive Network. From the R Journal, Volume 10/2, December 2018.](../fig/cran.png)